
A lot of the posts here and on other blogs deal with techniques, and that's only right – people go to these blogs to find useful tools, after all. However, this week I'm going to step away from this approach, and talk about a diagram that I created and how it moved things forward when a text document would not.
The reason why it moved things forward is that diagrams extract the essence of a situation, whereas text often provides more supporting information – but people are often unwilling to work through this extra information as they just want to be spoon-fed the minimum information necessary.
In deploying to a customer recently, we had an SQL Server job that was originally scheduled to run overnight – it copied from one database to a datamart, a standard SQL Server Integration Services data copy job. Unfortunately, it turned out that this particular organization needed the ability to kick of the job manually on an ad hoc basis. Not a specific problem; you can kick of jobs programmatically by running the sp_execute job stored procedure, you just need access to a couple of other items.
Or at least, it shouldn't have been a problem. The problem came in that this particular organization a) had pretty limited SQL Server Management expertise in house and b) had chosen to locate our system on the same server that hosted their email archiving system, a high-profile system that was owned by the legal department (what with our living in this litigious age where emails can be subpoenaed).
So we tried listing out roles that we'd have the service run under, and the permissions that they needed – no luck – the DBA in question was openly not reading the document. Escalations up the management chain got nowhere. So, time to try another approach.
“A picture paints a thousand words”. Well, we decided to try an architecture diagram (shown below).
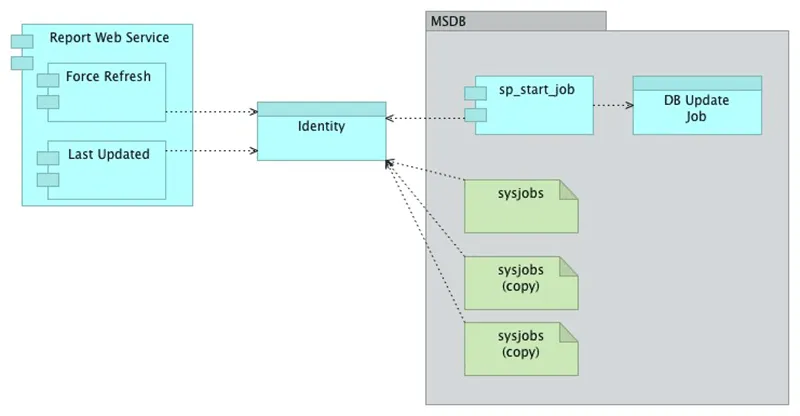
Let's talk through the key points for this diagram. First of all, it was an ArchiMate diagram, as the company in question had standardized on ArchiMate. The security object was modeled as a data object, with the service software as application components.
The objects were arranged left-to-right; this makes things easier to digest. We used grouping and, the result was a success – the DBA finally agreed to make the necessary changes.
So this diagram moved things forward when text did not. A summary of why this was:
- Most people are visual, especially in IT, and a diagram was easier to digest than a narrative.
- The use of boxes to show objects and connection lines to show interactions clearly marked out the items involved and how they depended on each other.
- Showing the overall structure of what could be invoking the services gave context to enable understanding.
- Providing an easy-to digest diagram also raised the point that the DBA's boss could then see and understand the proposed architecture.
Often it seems like creating a diagram is more work – and it can be. But sometimes it can be the only way to break through the barrier of non-understanding.

.webp)