
My last three articles described various ways of using Data Graphic Icon Sets, Data Bars, Text Callouts and Color By Value in Visio Professional, and this one demonstrates how to create custom Data Graphics. This is a little more advanced than the previous articles, and I will use a custom Icon Set as an example.
Before I discuss custom Data Graphics, I first need to explain a little about the structure of a Visio document. Everybody know that a Visio document can have multiple pages, and that there are stencils usually docked on the left side panel, from where master shapes can be dragged and dropped within the page. However, most users are not aware that a copy of the master shape is first placed into the local document stencil before the first instance is positioned in the page. The actual shape that is seen in the page inherits most of its attributes from its master in the document stencil. This means that all of the instances of a master shape that are seen in the page are inheriting attributes of the single master. This makes for file size efficiency but also means that crafty customization can be done on the master shape in the document stencil.
Switching Developer Mode On
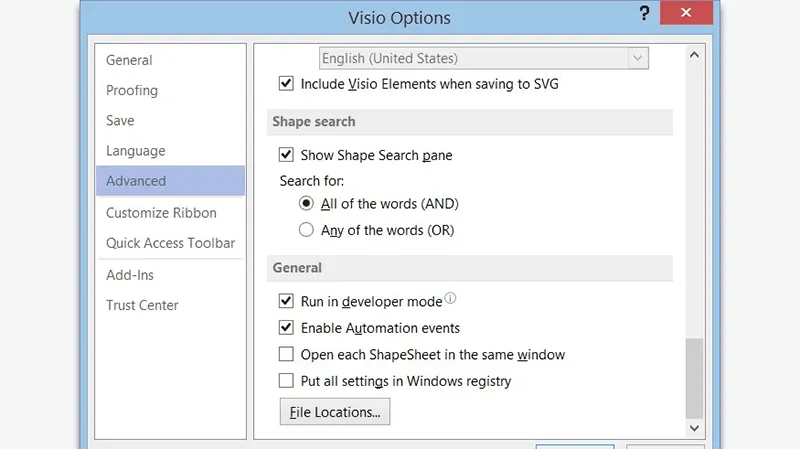
I ensure that my Visio application is running in developer mode by ticking FILE \ Options \ Advanced \ General \ Run in developer mode:
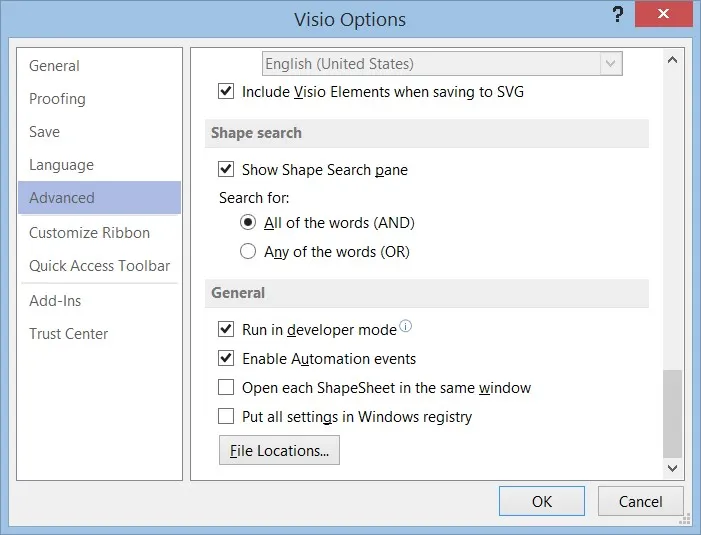
This enables a few menu items, such as ShapeSheet on the right mouse menu, but mainly switches on the DEVELOPER ribbon tab. The Drawing Explorer window provides a useful way to view the structure of the Visio document.
A Sample Flow Chart
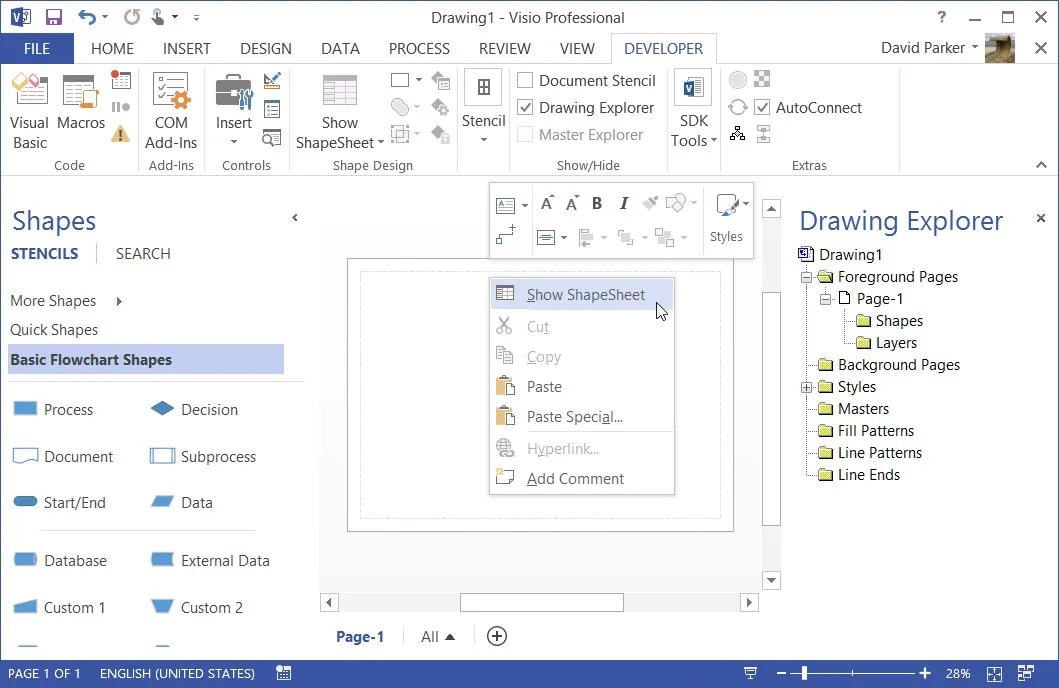
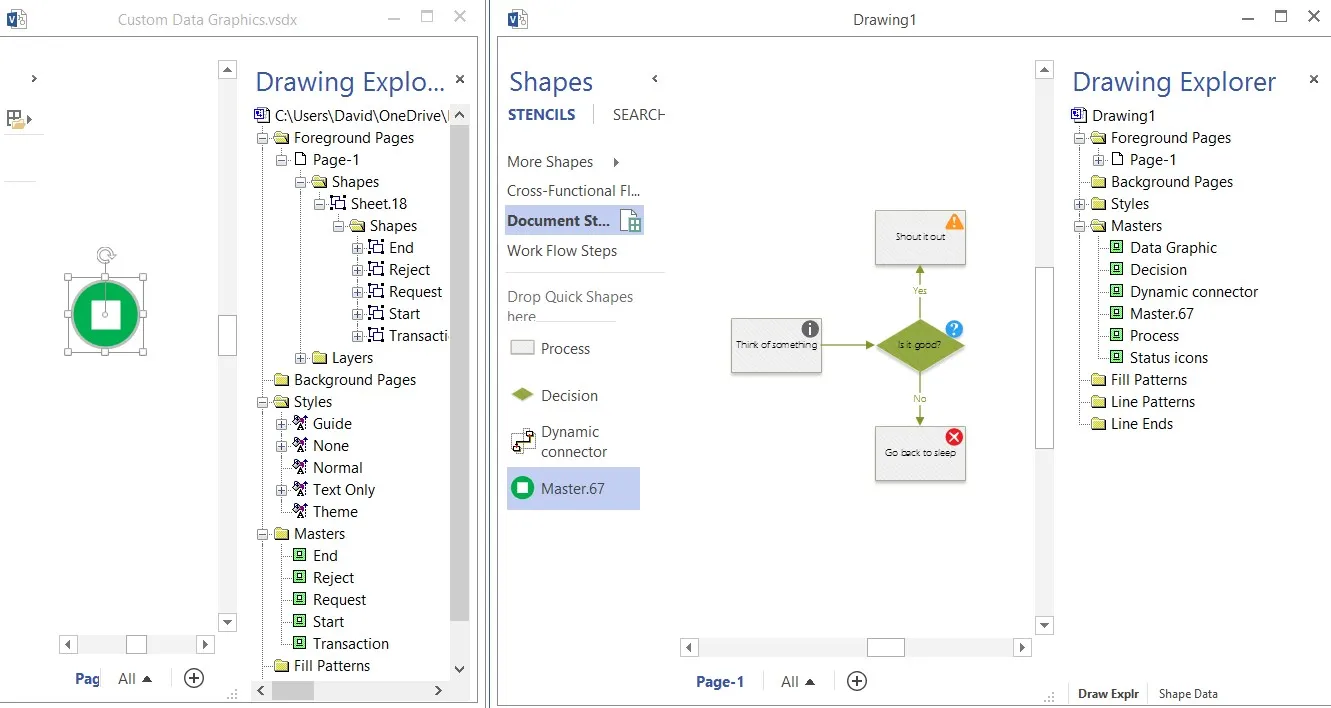
In this example, I have started a new Basic Flowchart diagram, and although there are master shapes displayed in the Basic Flowchart Shapes stencil, there are none in the Masters branch of the Drawing Explorer tree view.
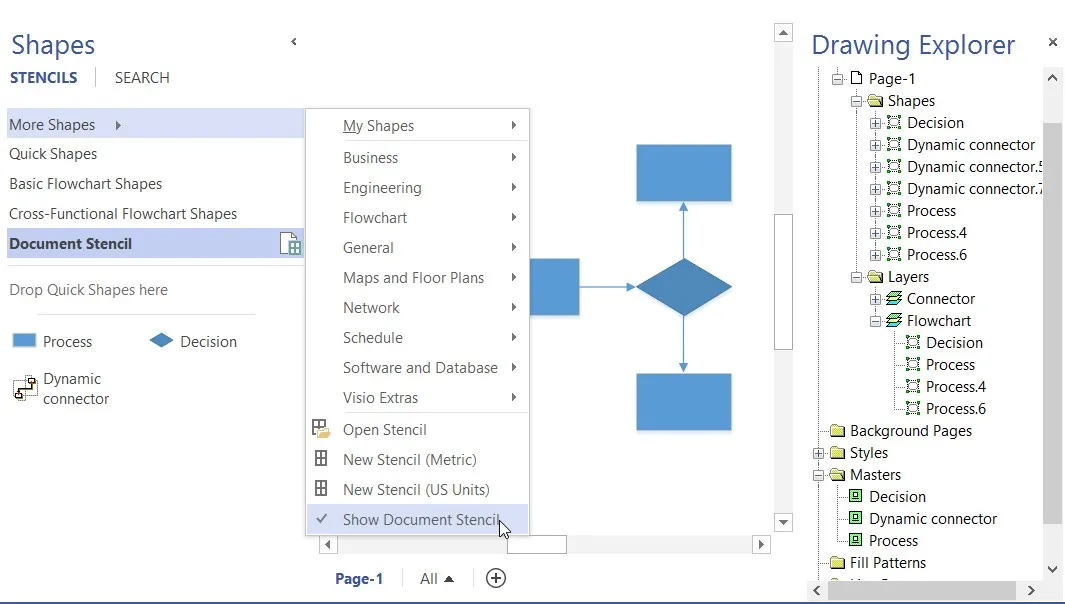
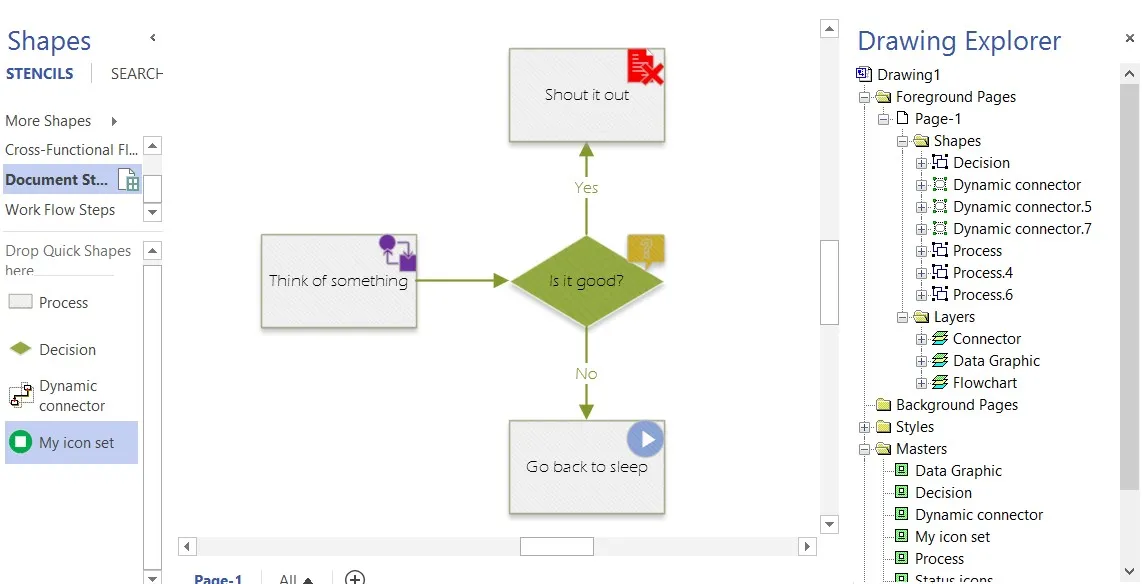
As soon as I dragged and dropped shapes from the Basic Flowchart Shapes stencil, then a copy of the master shape was placed onto the Document Stencil, which can be opened from the bottom of the More Shapes flyout menu. Notice that there are three masters but seven shapes in the Drawing Explorer tree view.
Now, when I add a Data Graphic Icon Set to my shapes, then the relevant Graphic Item master, in this case Status icons, is added to the list of document Masters, along with the Data Graphic master itself, which can contain multiple graphic items within it. This is true for Data Bars and Text callout Graphic Items too, but not for Color By Value, as that is achieved with formulas in the ShapeSheet.
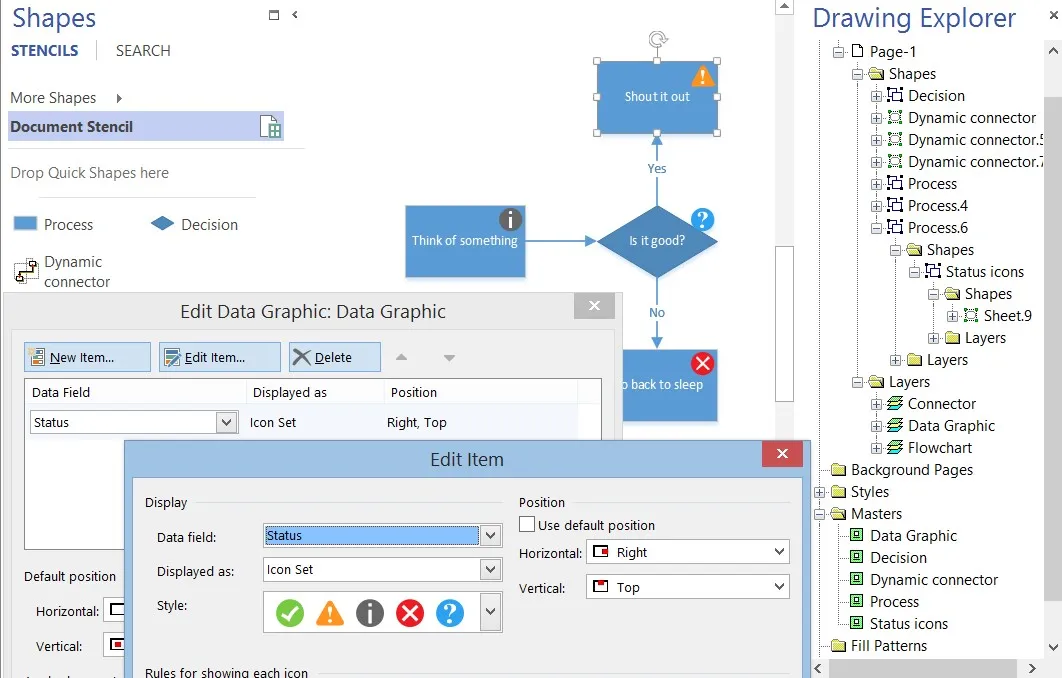
The drop-down list of Styles for Icon Set, Data Bar and Text Data field Displayed as are a combination of masters that are in a hidden stencil, plus any other suitably attributed masters that are within the document list of masters.
Creating a New Icon Set
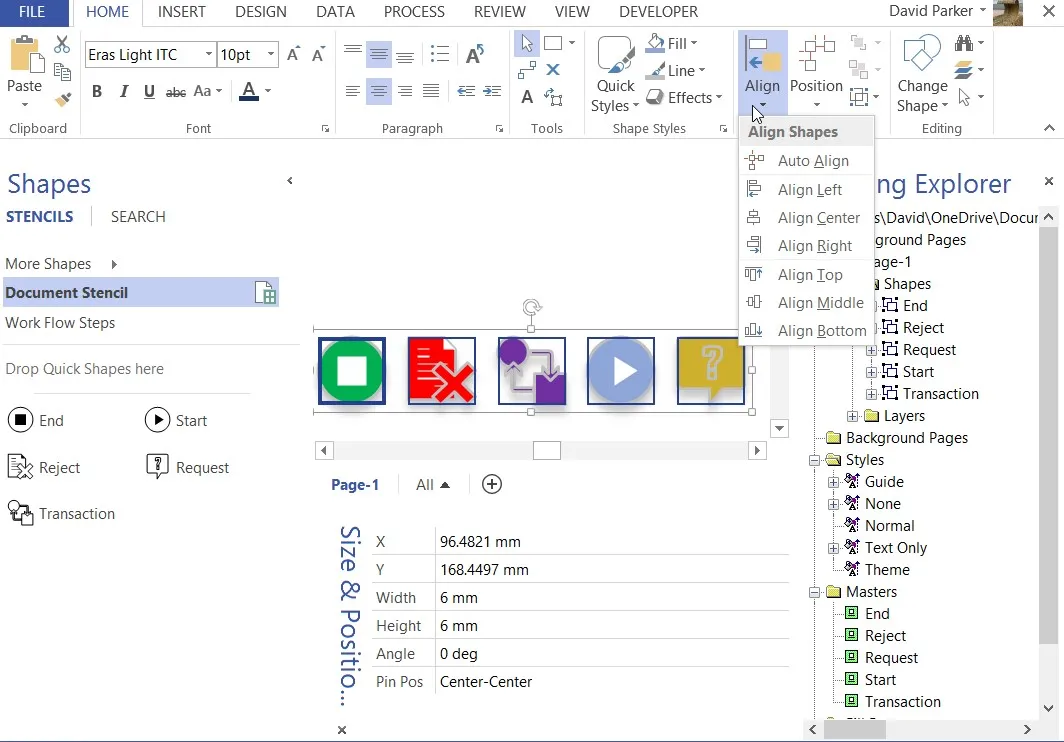
I opened a new Visio document, and placed five shapes in a row in the order that I want them to appear in the Styles drop-down menu. I selected shapes from an existing stencil, but I could use any shape or image. I then sized them all to be 6 mm (or 0.25 in) square, and formatted them to my requirements.
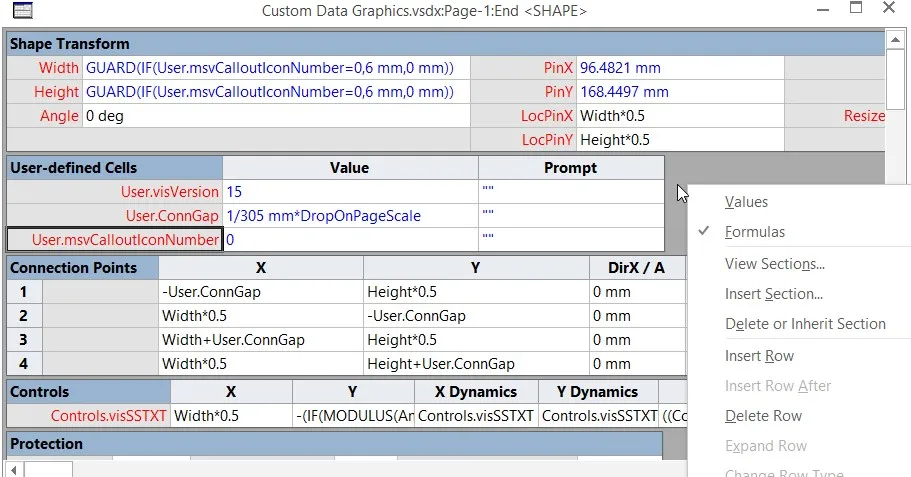
I then opened the ShapeSheet of each shape in turn, from left to right, and inserted a User-defined Cells row named msvCalloutIconNumber with the values 0 through to 4. I also edited the Width and Height formulas to =GUARD(IF(User.msvCalloutIconNumber=0,6 mm,0 mm)), changing the “=0” from 0 to 4 accordingly.
If there was no User-defined Cells section in the ShapeSheet, then I would just use Insert Section first.
I then aligned them all to be Center / Middle and grouped them.
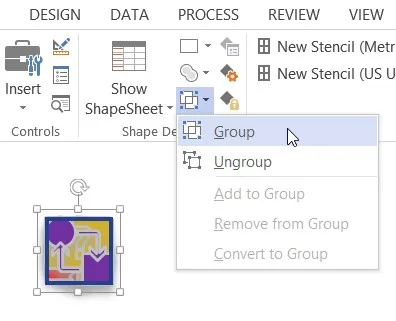
When I now look in the Drawing Explorer, I can see that a new group shape has been created, in this case Sheet.18, and my original shapes are inside it. I then open then ShapeSheet of the group shape and edit some of the Protection cells to 1.
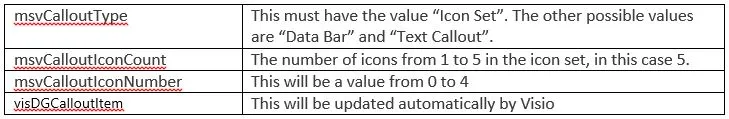
I also inserted a User-defined Cells section add added the four rows that are necessary to define this shape as an Icon Set.
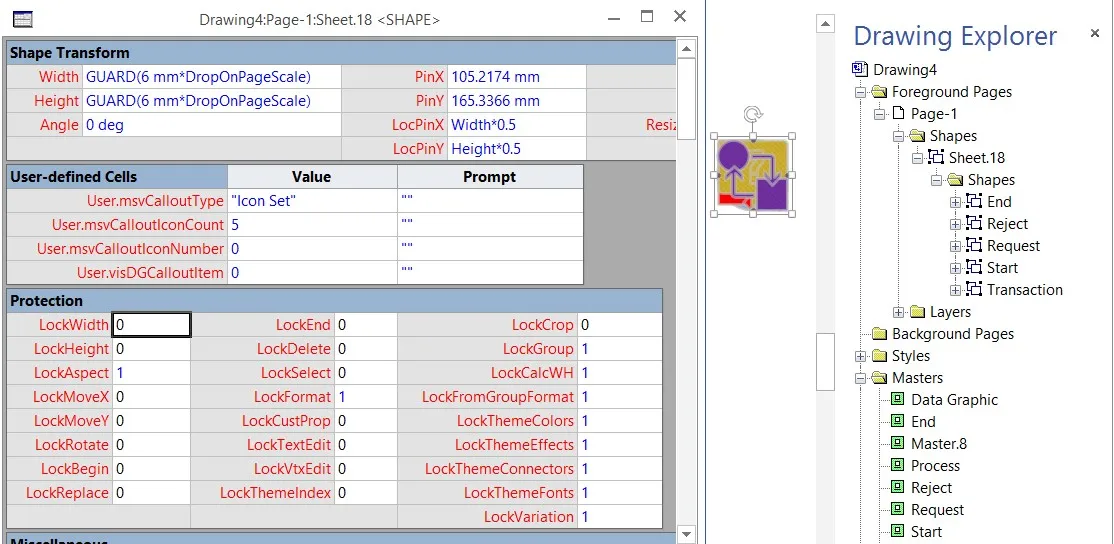
These cells are:
I also ensured that the group shape remains consistent in size by editing the Width and Height formulas to =GUARD(6 mm*DropOnPageScale).
It is also good practice to assign this shape, and its sub-shapes, to a layer named Data Graphic.
I then revisited the ShapeSheet of each sub-shape to amend the formula for the User.msvCalloutIconNumber cell because it now needs to get the value from the group shape. So, the formula =Sheet.18!User.msvCalloutIconNumber is inserted into each one.
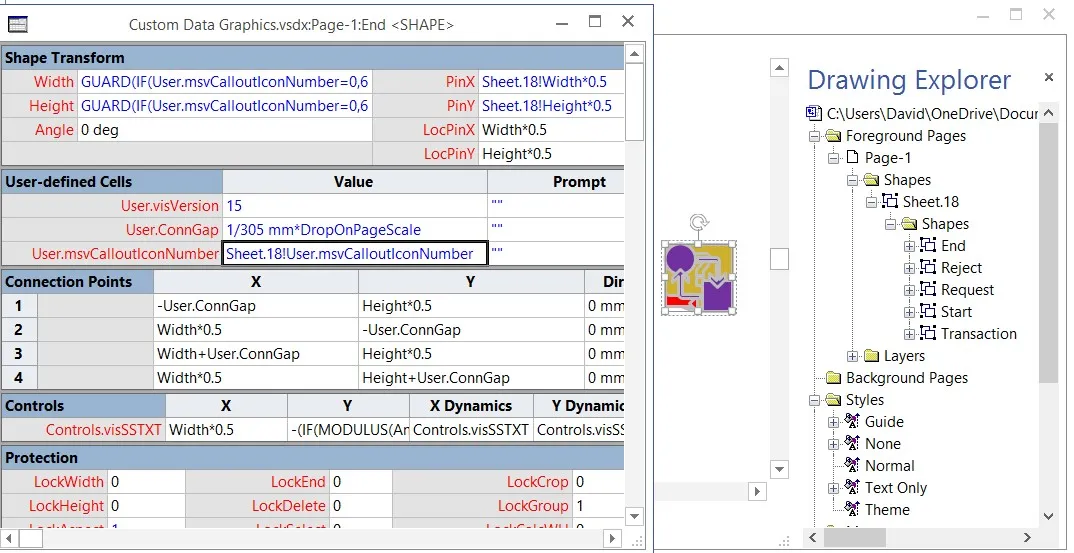
Each of the shapes which become invisible apart from the one that matches the User.msvCalloutNumber in the group shape.
I then copied the shape from my development document into the Document Stencil of my working diagram document. I can do this by Copy/Paste or, even better, by duplicating the shape … holding down the CTRL key whilst dragging the shape from the development document to the working diagram.
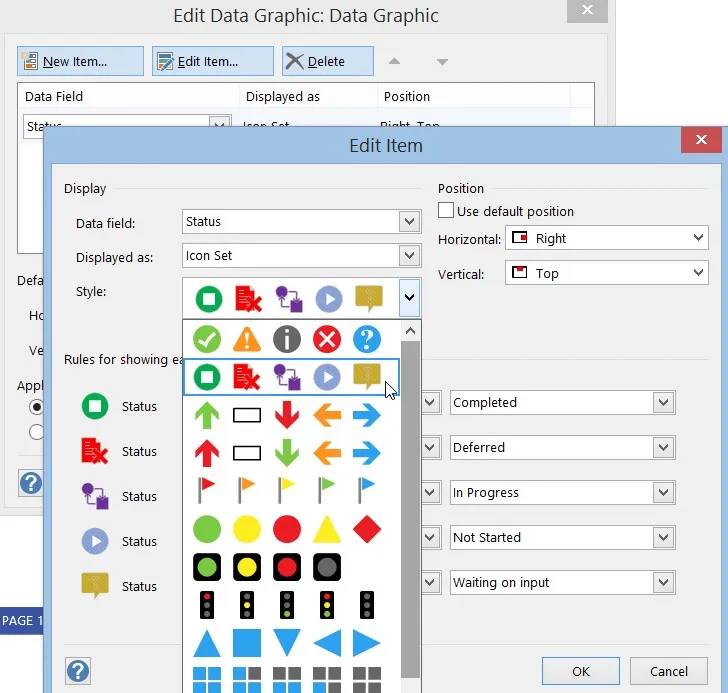
Now when I go back to editing the Style of a Data Graphic item, I see the new Icon Set in my drop-down list.
I can then see the effect of my custom icons in my diagram.
I can, of course, copy my new icon set to another stencil so that I can re-use it at any time.
I have written a VBA macro to perform all of the grunt work at http://blog.bvisual.net/2012/04/19/make-your-own-visio-data-graphic-icons-sets-automatically/ .
Summary
In this article, I have shown how to create a custom icon set. Data bars and Text callouts are similar, but a little more involved. All of these Data Graphic items are just normal Visio shapes, and can be made with images or vector geometry, however the latter does provide greater capabilities. Using custom graphics personalizes the diagrams and can promote more corporate ownership.

.png)