
There used to be an add-in for Visio to create process flow charts from a couple of Excel tables or text files, but that disappeared as part of the rationalization by Microsoft after they bought Visio in 1999. I often asked for it to be returned, even though it had some restrictions. Microsoft Visio has increased in capabilities since then, and now a new Data Visualizer feature has been added to Visio Pro for Office365. This is a much richer data driven diagramming tool than the old Flowchart Wizard, as you will see in this article.
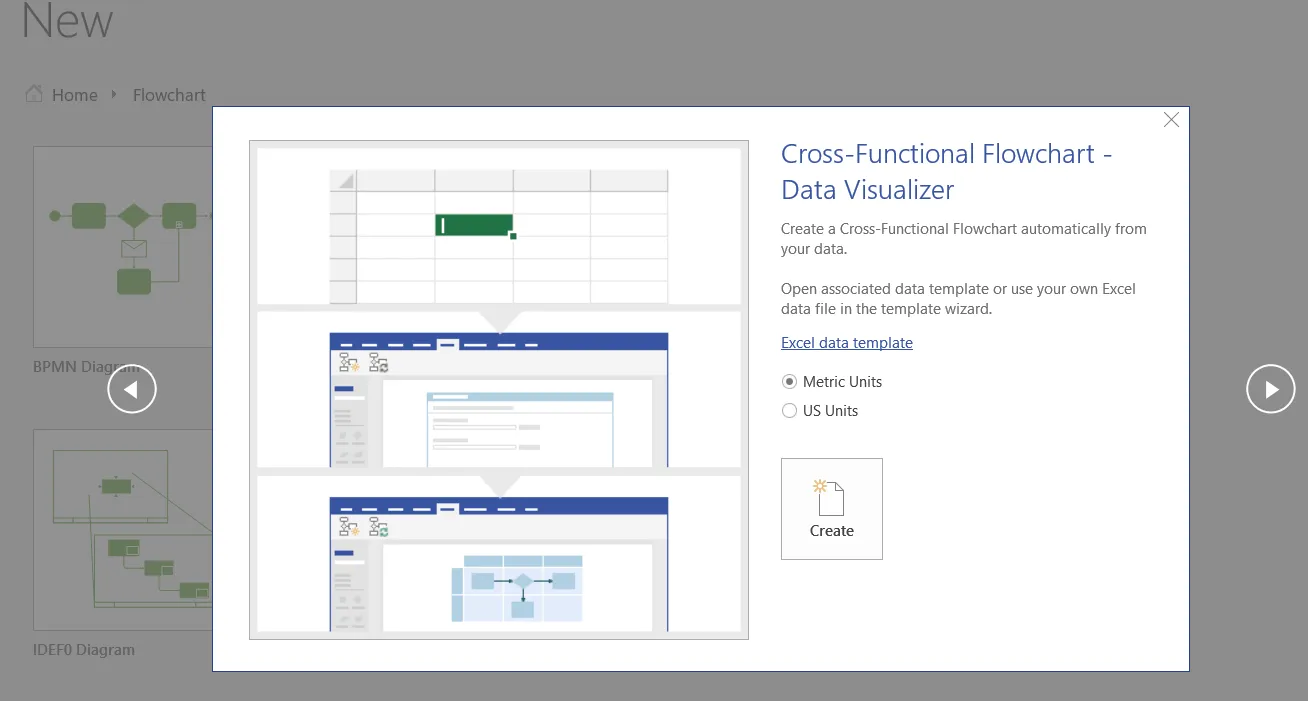
There are two Data Visualizer templates provided, one for simple flowcharts and one for cross-functional flowcharts, but the foundations are there for many other types of diagrams.
These two templates offer an Excel data template that can be used to create the source for the diagrams, if one does not exist already.
Cross-Functional Flowchart
The Excel Workbook
The Excel workbook displays three tabs by default, although there is a fourth one hidden. The first tab outlines the process for creating the diagram from data, which is as follows:
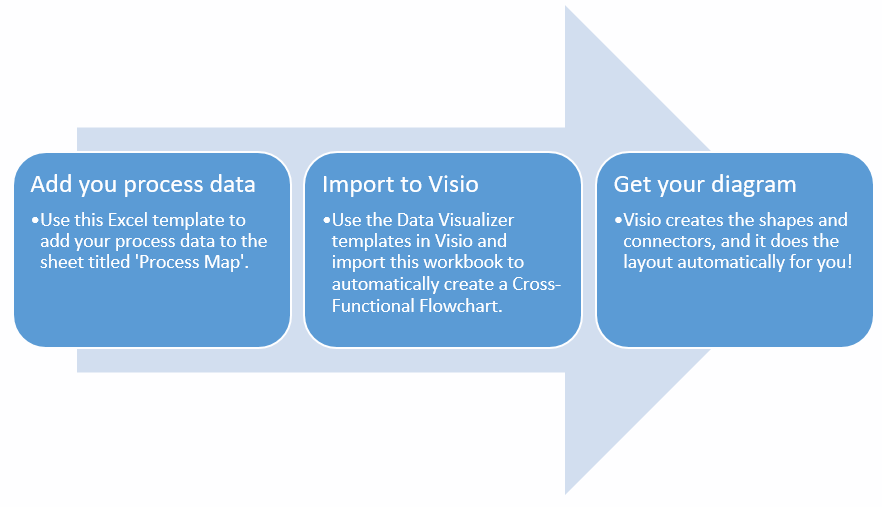
Data Visualizer Process
The second tab explains the columns that appear on the third tab.
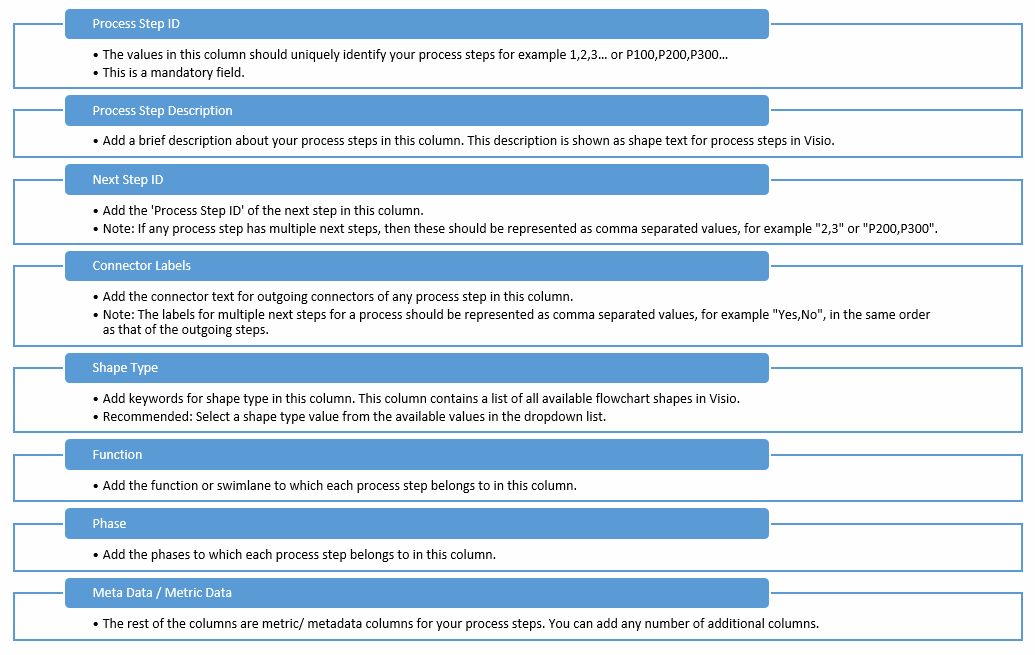
Data Visualizer Columns
In fact, these column names can be different than the recommended ones because there is an opportunity to map the columns during the wizard later.
The third tab contains a table containing the process shapes and their connections.
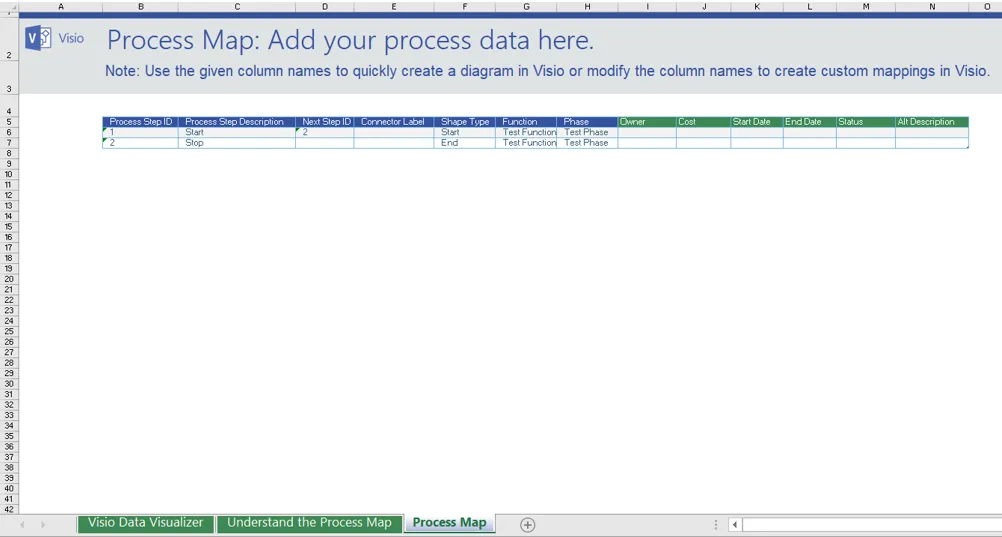
Process Map
The blue coloured columns are the required ones, and the green ones are optional. In fact, the workbook can contain many tables, including those created by Get & Transform Data (Power Query), that describe multiple flowcharts because the wizard allows the desired one to be selected later.
The fourth, hidden, tab, Shape Notation Mapping, lists the available master shapes that exist in the Basic Flowchart Shapes stencil. This table is used as a lookup for the values in the Shape Type column.
The following table is for an example training course module development process. Notice how the Next Step ID and Connector Label columns define the connections and their optional text.
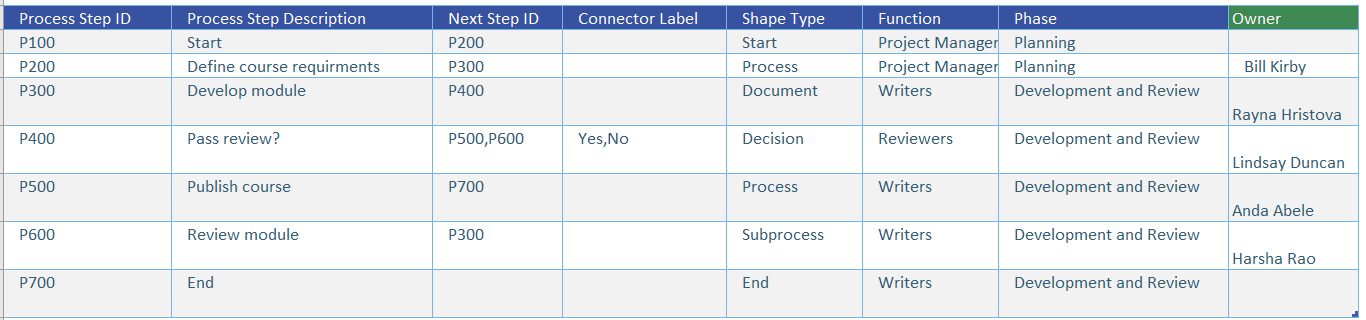
Example Table
The Data Visualizer Wizard
The Data Visualizer wizard leads through four or five steps, depending upon the type of diagram required.
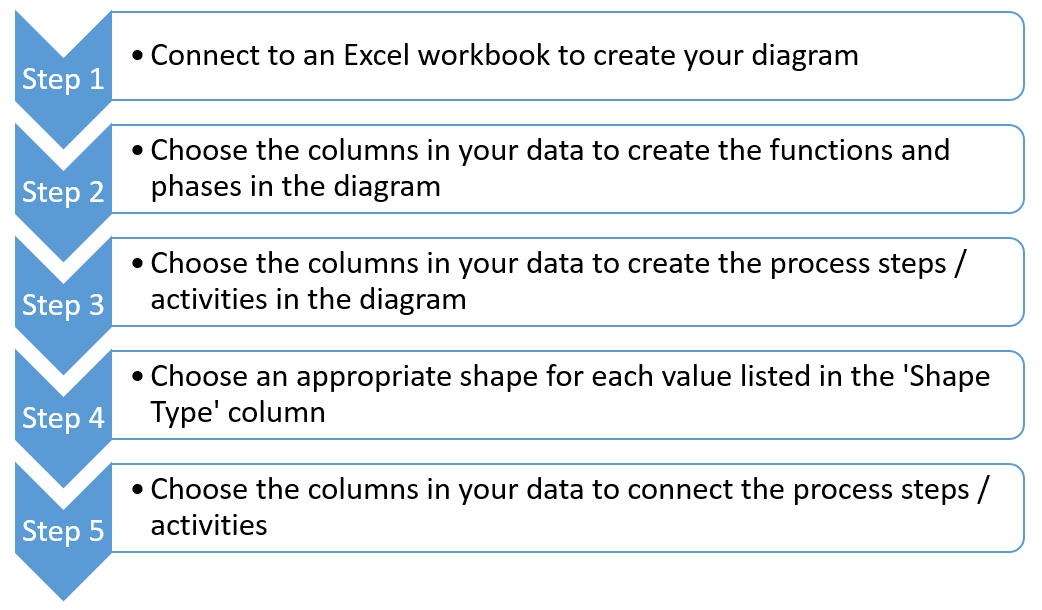
Data Visualizer Steps
Step 1
There are three types of diagrams to select from (Basic Flowchart, horizontal or vertical Cross-Functional Flowchart), then the table within the selected workbook.
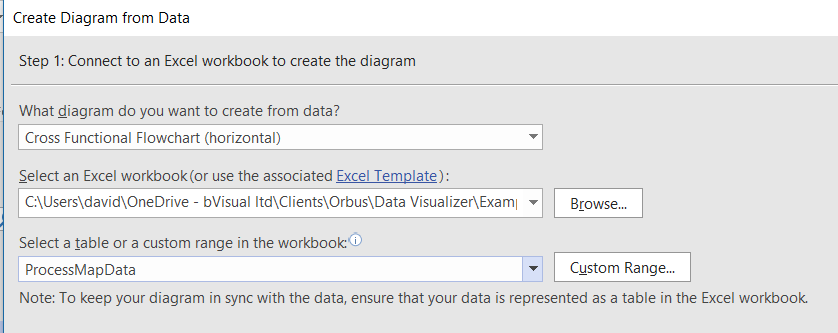
Data Visualizer Step 1
Step 2
This step does not appear if a basic flowchart is selected in the previous step because it defines the swimlanes and phases of a cross-functional flowchart.
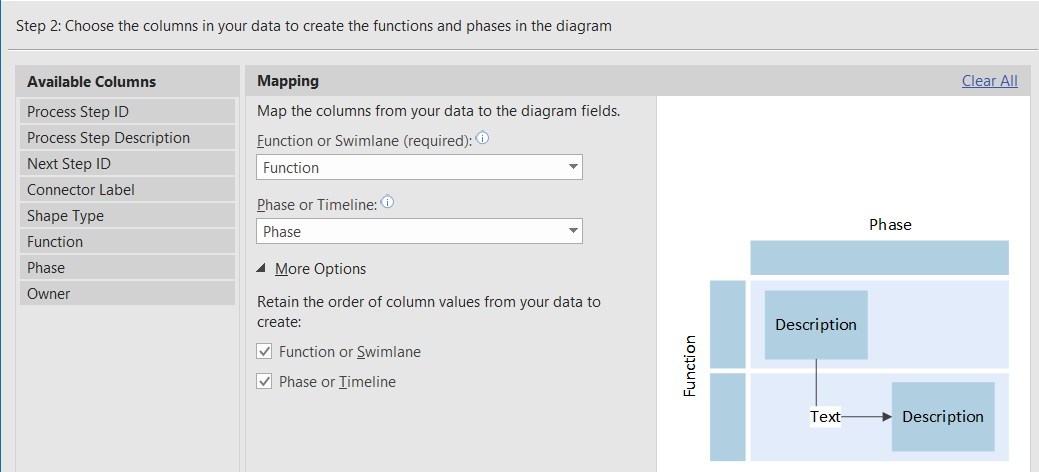
Data Visualizer Step 2
Step 3
This step maps the columns for the unique identifier for each row (Process Step ID / Activity ID), and the shape text (Process Step / Activity Description) and type. It also allows an optional Alt Description for accessibility to be mapped.
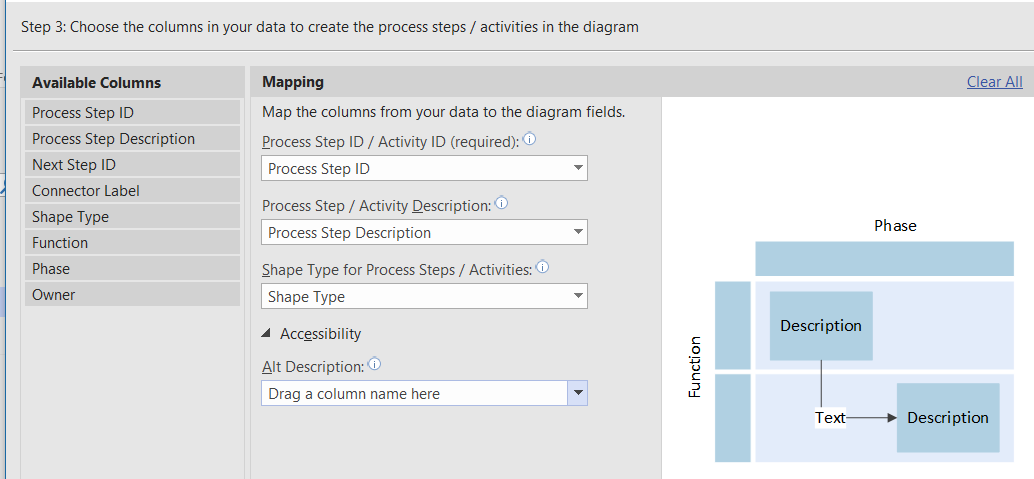
Data Visualizer Step 3
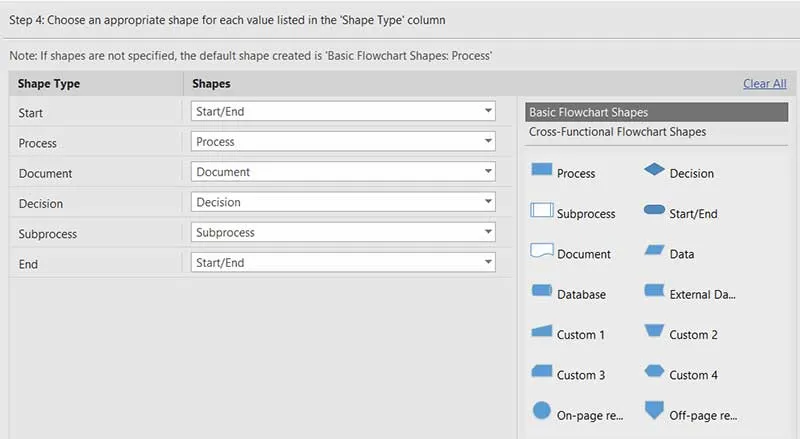
Step 4
This step allows for the values in the Shape Type column to be mapped to masters on a stencil.

Data Visualizer Step 4
Step 5
This final step defines how the optional connections between shapes are described, and the text to be added to each connector.
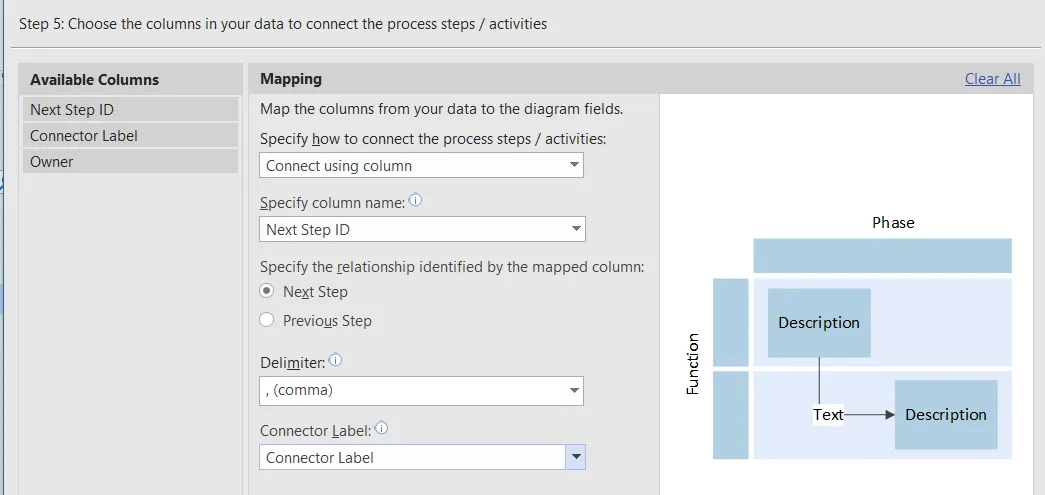
Data Visualizer Step 5
The Diagram
The diagram is then created according to the selections made in the wizard. Shape Data rows are added if they do not exist already, and the values are updated.
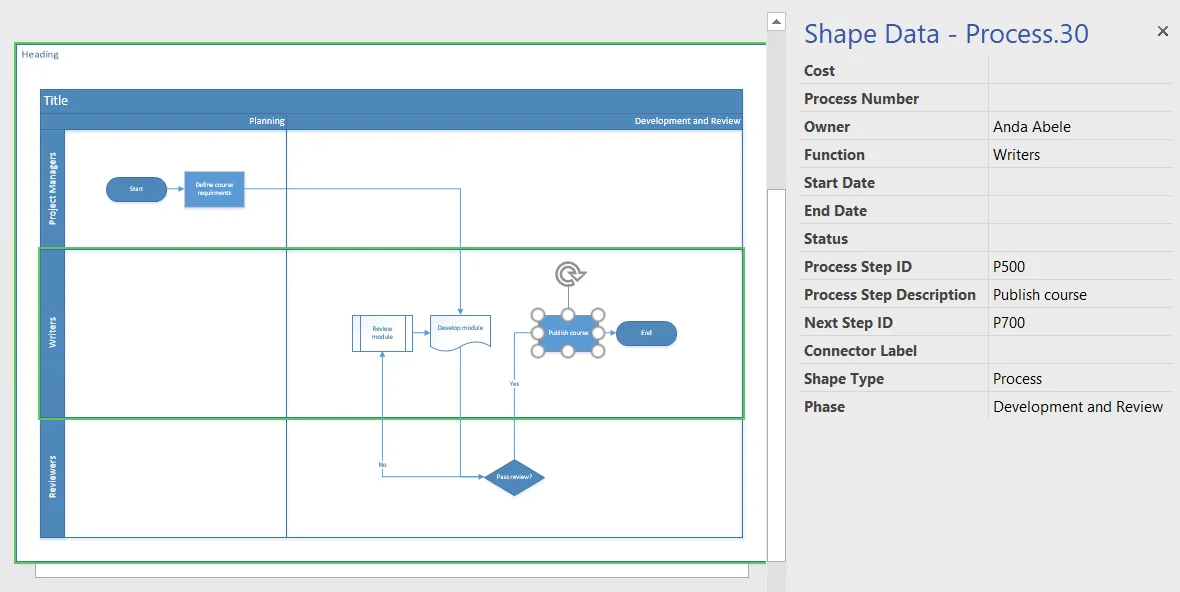
CFF Diagram
It may be necessary to tweak the diagram, post-creation, especially on shapes such as Decision shapes, because all the automatic connections are dynamic, but sometimes they need to be made static to avoid juxtaposition of lines. In the following example, the start of the connector labeled ‘No’ was re-glued to a connection point.
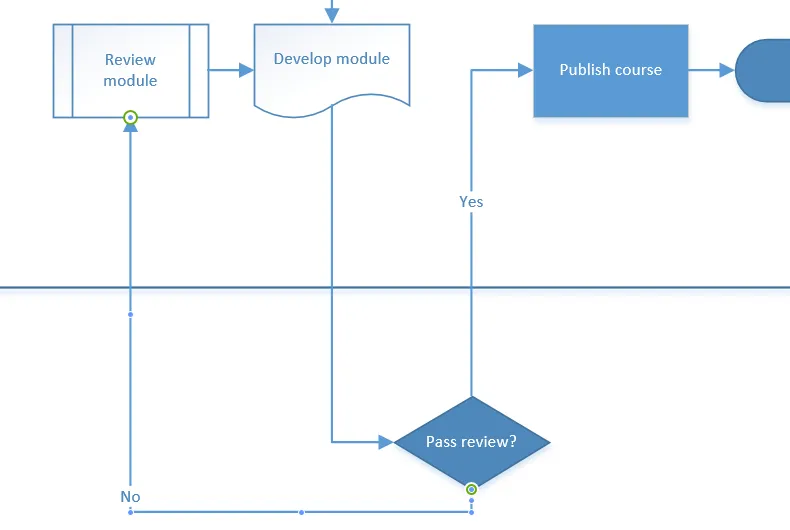
Amended Diagram
Refreshing and Exporting
The process diagram is created within a special container shape. The Refresh and Export buttons on the Data / Create from Data ribbon group become enabled when this container is selected.
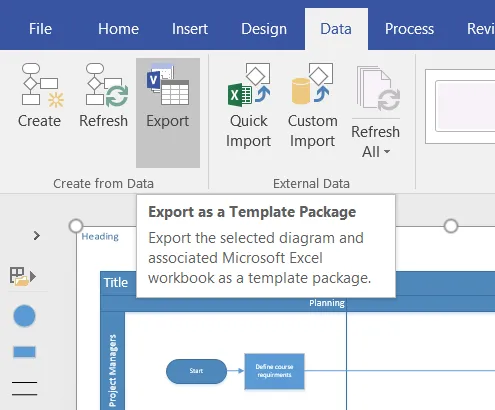
Visio Ribbon
The Refresh action will update the diagram from the linked Excel table, if necessary. This will not only update Shape Data rows, but re-make any connections after adding and deleting shapes.
The Export action will create a Microsoft Visio Template Package file, with a vtpx extension, that contains both the Excel and Visio templates.
If this file is given to someone who has Visio Pro for Office 365, then it can be installed by opening it.
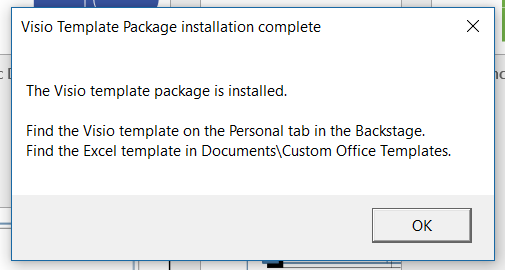
Installation Complete
Once installed, it is available in the PERSONAL category in Visio.
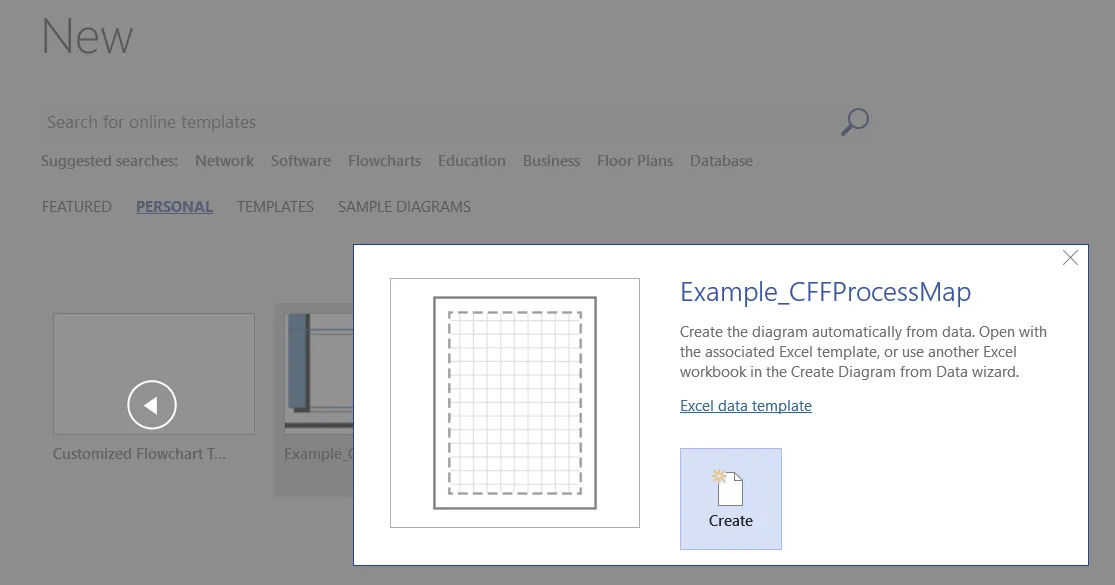
Custom Template
A new Excel workbook can then be created from the Excel template, and linked to a new Visio diagram created from the Visio template.
Summary
This is an exciting new feature which should be useful for many different scenarios. It requires Excel, but this means that Power Query can be used from an increasingly large number of data sources. I have written elsewhere about how this can be done (see my blog), but there will be many other solutions based on Data Visualizer in the future.

.webp)