
The Organization Chart solution is one of the top three uses of Visio. It is a very old solution, but it can be used with the newer data-linking feature with some caveats. So, in this article I will describe how to enhance organization charts with the data linking features in Visio Professional. Organizational charts are often simply referred to as "org charts".
Creating an Org Chart from Excel
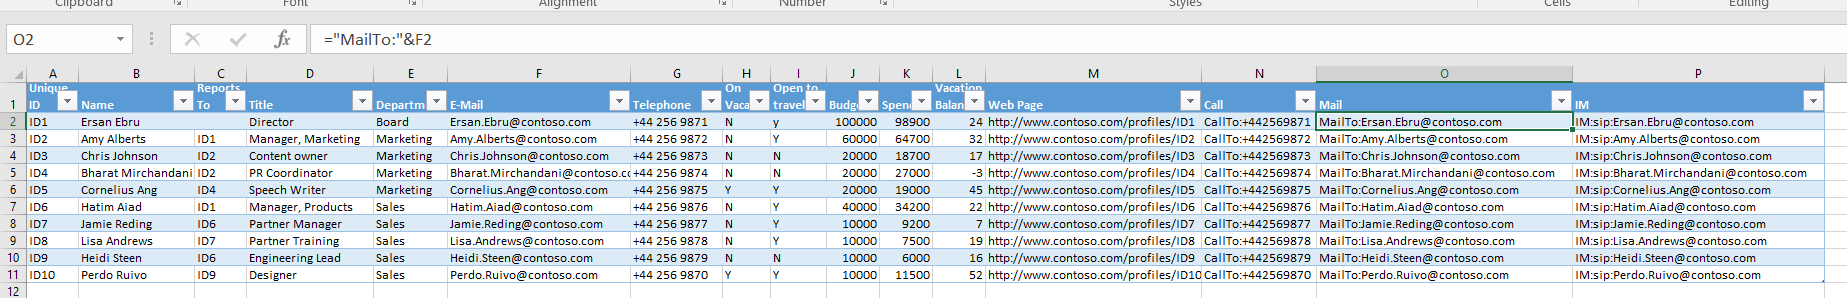
First, I start with the source data. It can be enhanced to automatically create any number of hyperlinks per shape. I have chosen a sample Excel worksheet table which is slightly different than the sample supplied with Visio.
Since the above image is difficult to read, I have transposed the first two rows in to a vertical table.
Unique IDID1NameErsan EbruReports toTitleDirectorDepartmentBoardEmailErsan,Elbu@contoso.comTelephone+44 256 9871On VacationNOpen to TravelYBudget0Spend0Vacation Balance24Web Pagehttp://www.contoso.com/profiles.apx?ID=ID1CallCallTo:+4425689871MailMailTo:Ersan.Ebru@contoso.comIMIM:sip:Ersan.Ebru@contoso.com
Notice that I am using a Unique ID field, rather than the Name as the key. Therefore the Reports To column. This is sometimes more realistic, and can be used for empty positions.
I actually used Excel cell formulas to produce the last four columns, but the point is that they each contain valid hyperlink protocols.
Running the Organization Chart Wizard
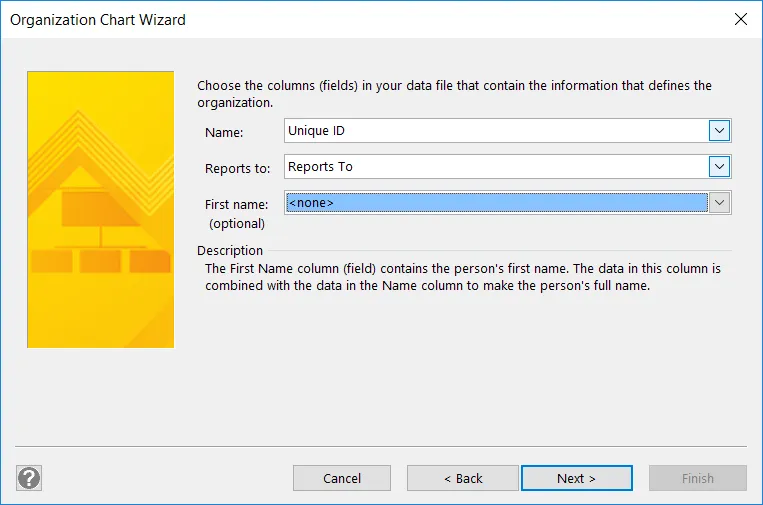
I then used the Organization Chart Wizard in Visio and selected the Excel file, and chose the Unique ID as the Name, and Reports To as the Reports to columns/fields.
I then only chose to display the Title field.
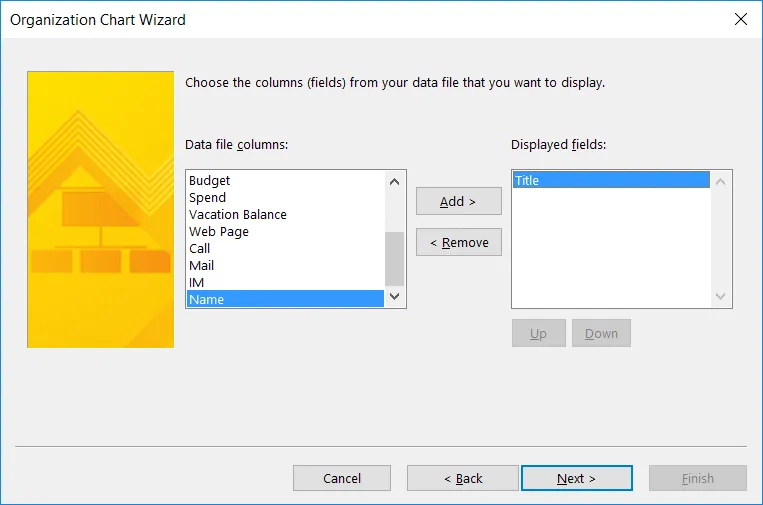
Then, I added just the Shape Data fields that are already on the Org Chart shapes.
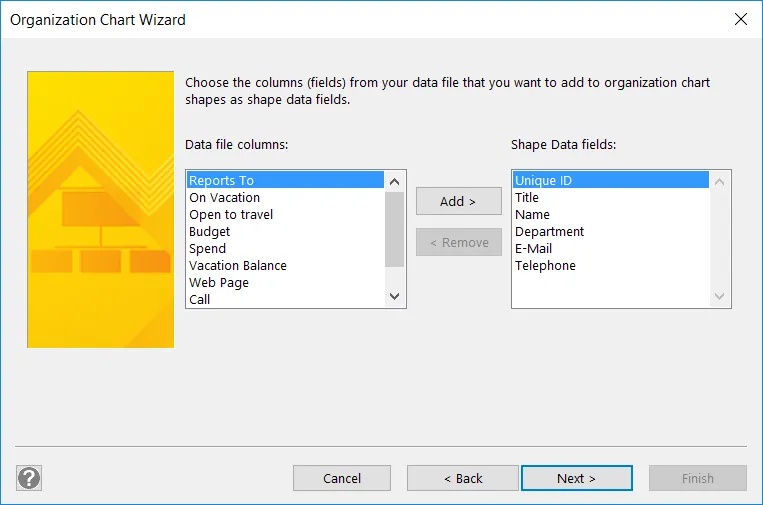
Unfortunately, Unique ID is not one of the normal Shape Data columns, but the org chart seems to appear alright at first.
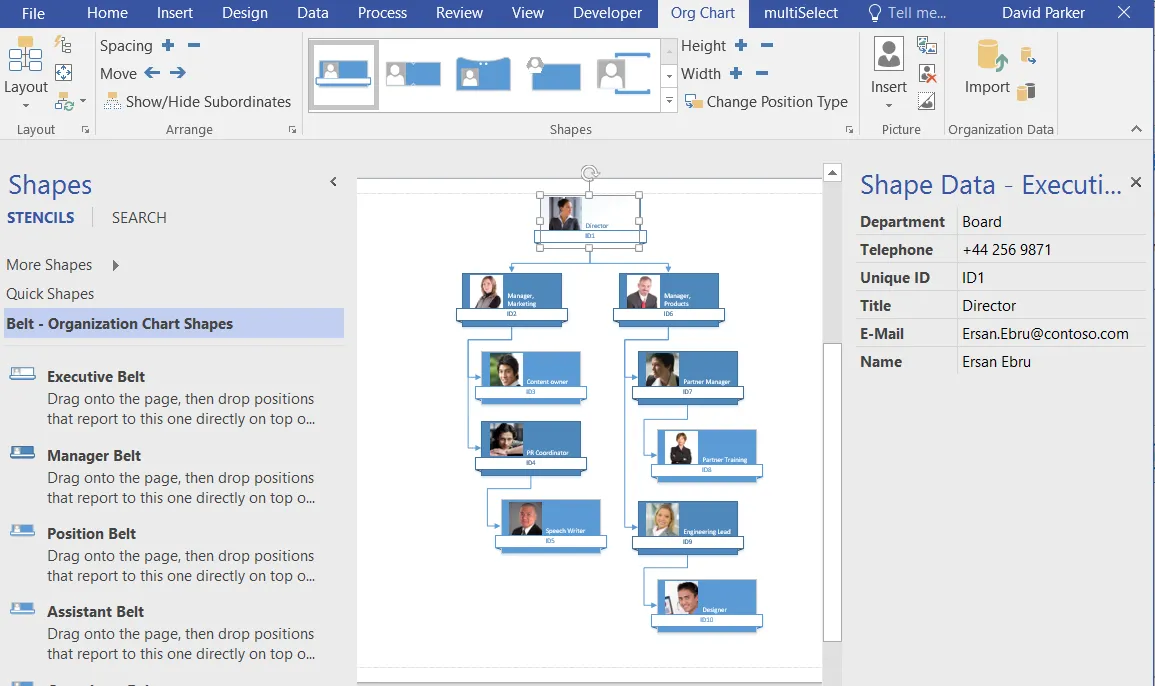
However, when I looked closely at one of the shapes, I could see that it is the Unique ID that is displayed prominently, not the Name. When I opened the Org Chart \ Picture \ Options dialog, I see that Block 2 appears to have the Name, but there is also another Name available for selection. So, I chose the second Name field for Block 2.
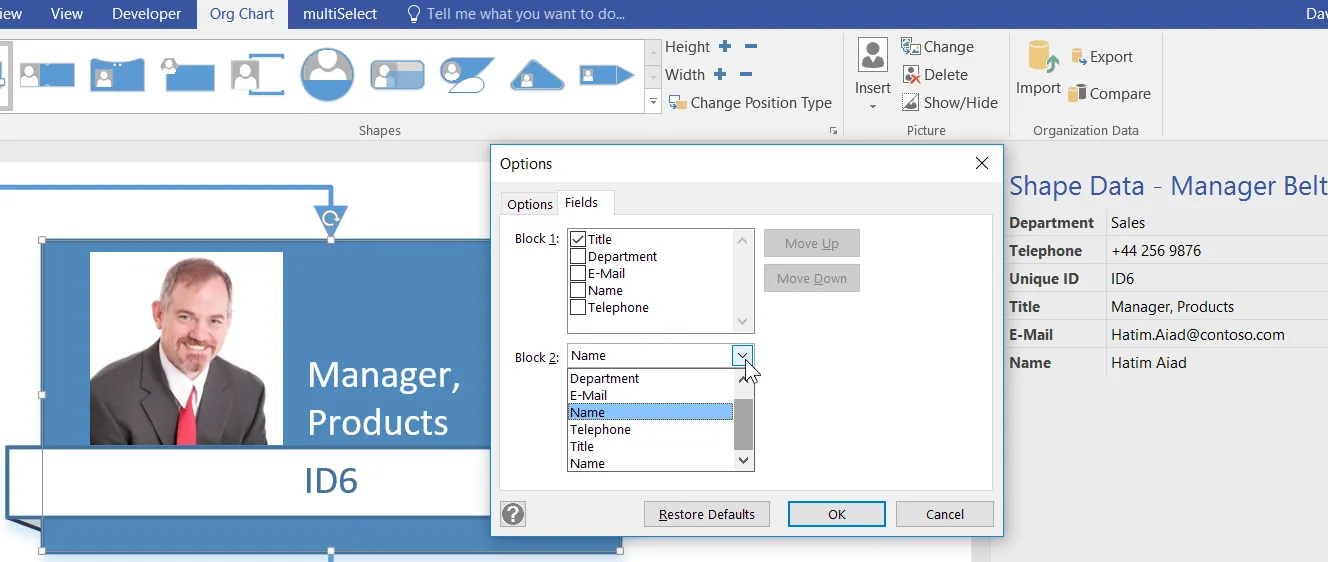
This solved the display problem, so I opened the ShapeSheet to see what has happened. There I can see that a new Shape Data row has been added with the ocwiz_1 row name, and the label is Name. I also noticed that the exiting Name row was updated to have the Unique ID label.
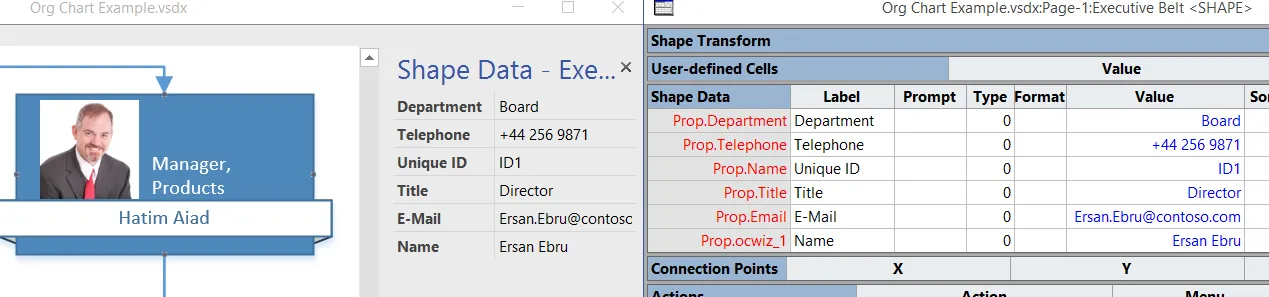
So, this is why there appear to be two fields called Name in the Block 2 list!
Overlaying with Linked Data
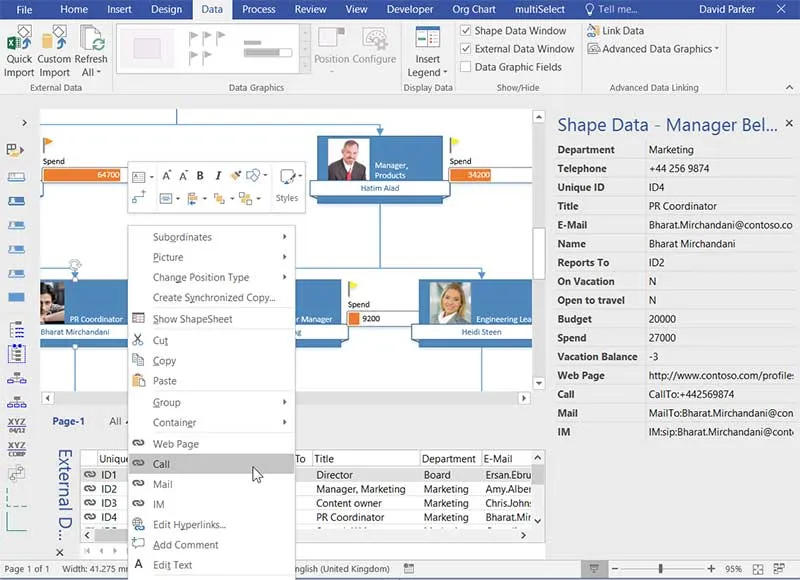
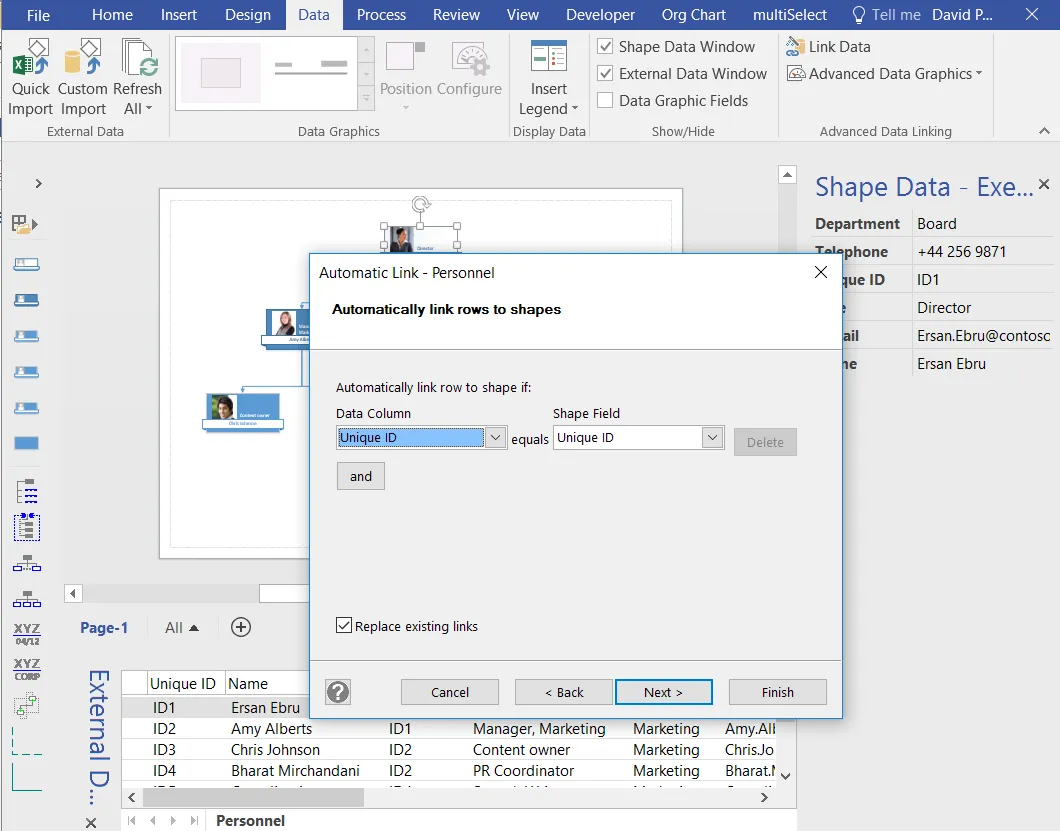
I then used the data-linking feature to overlay with the same worksheet table. The following screenshot is from Visio 2016, where the Link Data to Shapes button from Visio 2013 has become the Custom Import and Advanced Data Graphics buttons. I did re-layout the shapes with wider spacing in anticipation, and then matched the Unique ID in the shapes with the Unique ID in the table.
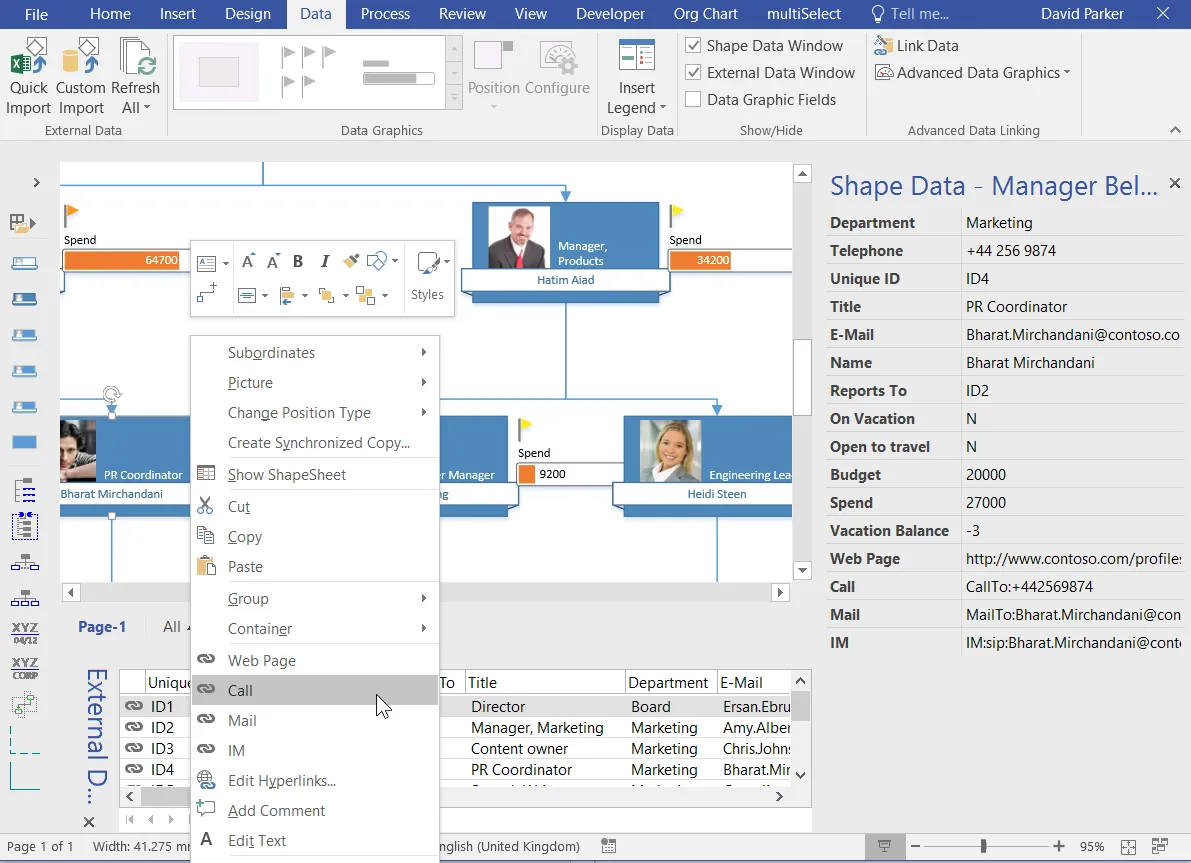
This action added extra Shape Data rows, and automatically created four hyperlinks on each shape. This enables the consumer to click on a link on the right mouse menu of each shape to open a target document or to communicate with the target person:
- Web opens a page in a web browser
- Mail starts an e-mail addressed to the target
- Call to start call using Skype or similar
- IM to start an instant messenger session using Skype or similar
These hyperlinks will also be available to Office 365 or SharePoint users, if the Visio diagram is displayed in a SharePoint web page using the Visio Web Access control.
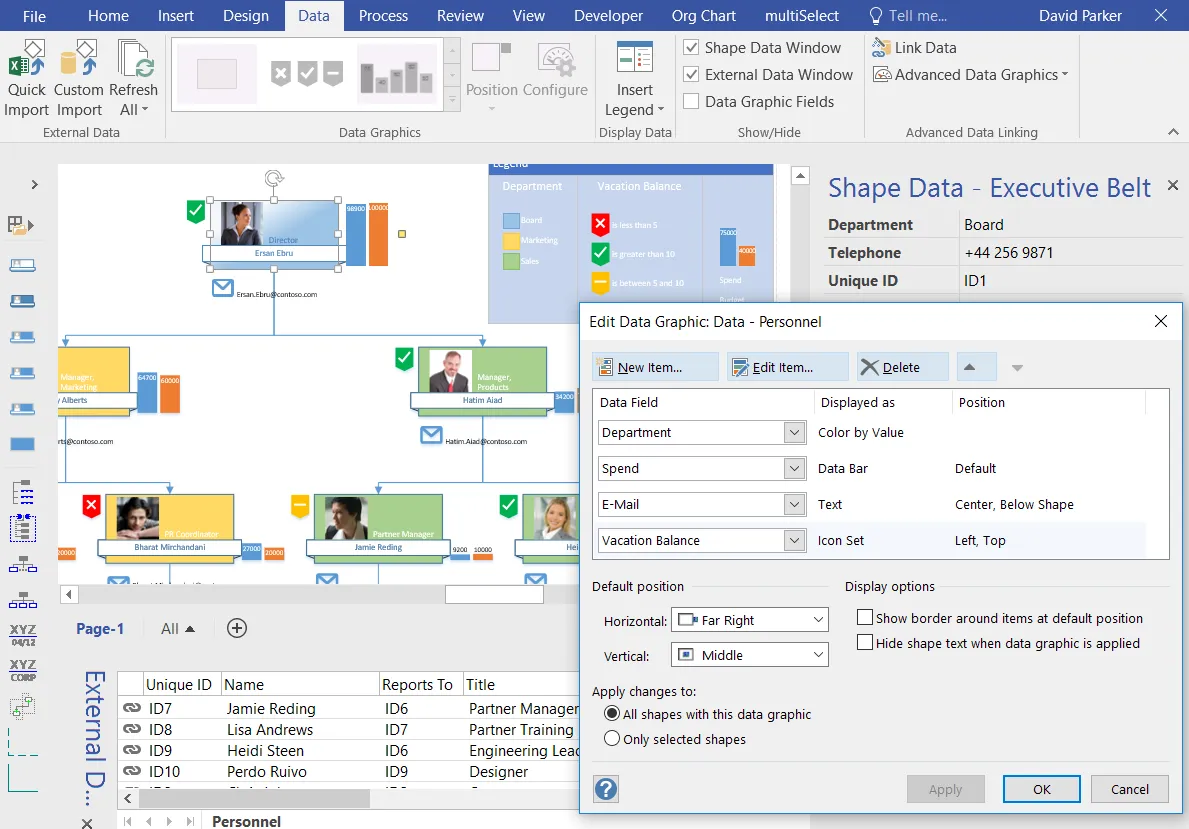
I then enhanced the Data Graphics and inserted a legend.
Organization charts created in this way are partially automatically refreshable. The Unique ID and Reports To columns are only used to create the hierarchical structure of the diagram. All of the other information in the shapes can be updated from the source.
Summary
In this article, I have demonstrated how Visio Professional users can enhance diagrams created with the Organization Chart Wizard. They can be overlaid with operational intelligence that can be automatically updated, when the source data is edited and saved. Org Charts are a useful Visio tool that can enhance your range of skills. To learn more about Visio, try Edit Shapes in Visio or How to Use Layers in Visio

.webp)