
Data Graphic Icon Sets in Visio 2013
Microsoft introduced Data Graphics in Visio 2007 Professional and the feature has been largely the same ever since. Over the next few blogs I will go through different aspects of Data Graphics, starting with Icon Sets in this article.
Icons can be used on shapes to indicate the presence of different data values within them. This saves time in having to read the actual values and increases the comprehension of the data at a glance.
Each icon set can have a maximum of five variations, although you could potentially have a sixth as the default where there is no match.
Deciding on the example data
I need some example data to display icons for, and there is a useful chart on the Microsoft website that compares the features in each version of Visio since 2007 (see https://products.office.com/en-us/visio/microsoft-visio-2013-visio-version-comparison ). I have extracted the data from this webpage into a table, to display it more visually.
Creating Shape Data rows
So, I made Shape Data rows on a rectangle shape for each column in the above table, and inserted the Title as text (using INSERT \ Field ) in the centre of the square. I made the bottom five Shape Data rows as fixed lists, thus enabling me to select a value from a drop-down list.
The values in the Requires fixed list are actually from the following table, with the addition of 0 as a neutral choice.
Each of the Visio version Shape Data rows have a choice of 4 values in their fixed list, and there are 5 categories.
Creating Icon Sets
So, I selected my shape and then clicked on DATA \ Display Data \ Data Graphics \ Create New Data Graphic…
This opened the New Data Graphic dialog where I clicked New Item…, then I chose More Fields… from the Data Field drop-down list. This opened the Field dialog where I selected the Shape Data category and then the first of the fields; Visio 2007, that I wanted to create an icon set for.
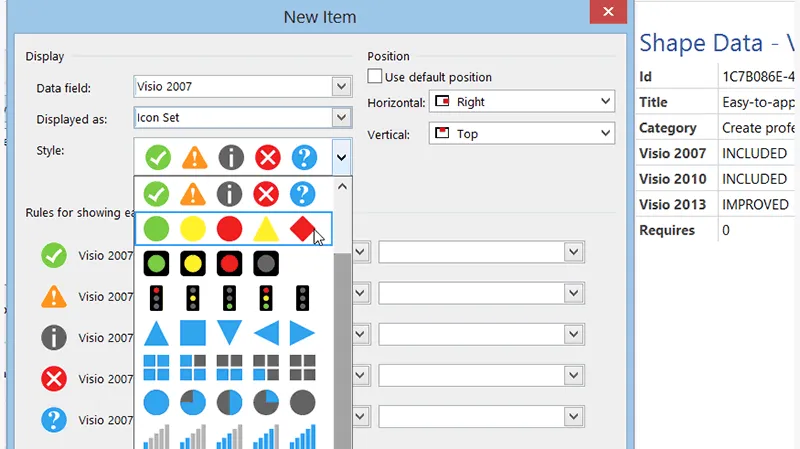
The next action was to select an icon set from the built-in ones that are available.
In fact, I only needed three of the five available icons in the set, and I entered the words that the Shape Data row needs to match.
Note that you can enter values or expressions that are constructed with ShapeSheet formulas.
I decided that I want to have Visio 2007 at the top left, Visio 2010 in the top center, and Visio 2013 in the top right.
Notice in the above screenshot that the icons are added as extra sub-shapes within each shape. This means that any shape that Data Graphics are applied to must be a group shape otherwise Visio will make it into a group shape. This means that any geometry that is part of the top level of the shape is in danger of obscuring any icon sub-shapes. Also bear in mind that a lot of extra shapes are being added to the Visio document and therefore there will be an increase in file size.
The full set of Category values are:
- Create professional and engaging diagrams more easily than ever
- Model business rules with standard process notation
- Take advantage of enhancements that make Visio a more powerful and complete diagramming tool
- Use a wizard to link diagrams to data without writing any code
- Work together on a single diagram with your colleagues
So I decided to use the Contains operator with a unique word in each possible value.
Finally, I added an icon for the Requires values as a different coloured flag icon in the bottom left corner of the square.
Icon positions
In fact the position of icons can be any one of 49 combinations in and around the shape.
Horizontal – Far Left, Left Edge, Left, Center, Right, Right Edge, Far Right
Vertical – Above Shape, Top Edge, Top, Middle, Bottom, Bottom Edge, Below Shape
Moreover, I can place multiple icons with the same position and they will order themselves adjacent to each other.
Inserting a Legend
I added a legend to the diagram from DATA \ Display Data \ Insert Legend in an attempt to explain the icons.
I could edit the legend items manually by clicking on the text, or I could have deleted parts, because the automatic legend is not always the optimum arrangement.
Using the Icon Sets stencil
Fortunately, Microsoft have also supplied a stencil with all of the icon sets on it. It can be found under More Shapes \ Visio Extras.
Each of the shapes on the stencil have a Display Icon Shape Data row with a possible choice of 0 to 5 (although some have fewer because they do not have five icons).
This meant that I could build my own legend shape easily by adding text to each desired variance:
Summary
In this article, I have shown how to use the Data Graphic Icon Sets with shapes that have Shape Data, and how to create legends to explain them. These icons are just normal Visio shapes, and it is possible to make custom icon sets either with standard vector geometry or with imported images. This will be the subject of a future article.

.webp)