
I have just returned from the annual Microsoft Ignite conference, and was proud to be demonstrating the preview of the Visio custom visual for Power BI, along with the Microsoft marketing and development team. The response to this new feature was really exciting, and I believe that it is an extremely important development, not only for Visio, but also for Power BI. For those of you who are not aware of Power BI, it is a free self-service business intelligence tool that runs on the cloud. If you are familiar with Excel, then you should be able to create reports and dashboards quite easily. It can be used authenticated within an organisation’s Office 365 environment, or it can be exposed to the whole internet. There are an ever-increasing number of data-connectors and visualizations available for it, that provides clarity for existing data in a more concise manner, but also potentially reveals relationships that have been previously impossible to understand. The preview Visio custom visual adds the ability to integrate any Visio diagram with the other types of visuals already available. A click on a Visio shape can filter other visuals, or other visuals can highlight and zoom to shapes within the Visio page.
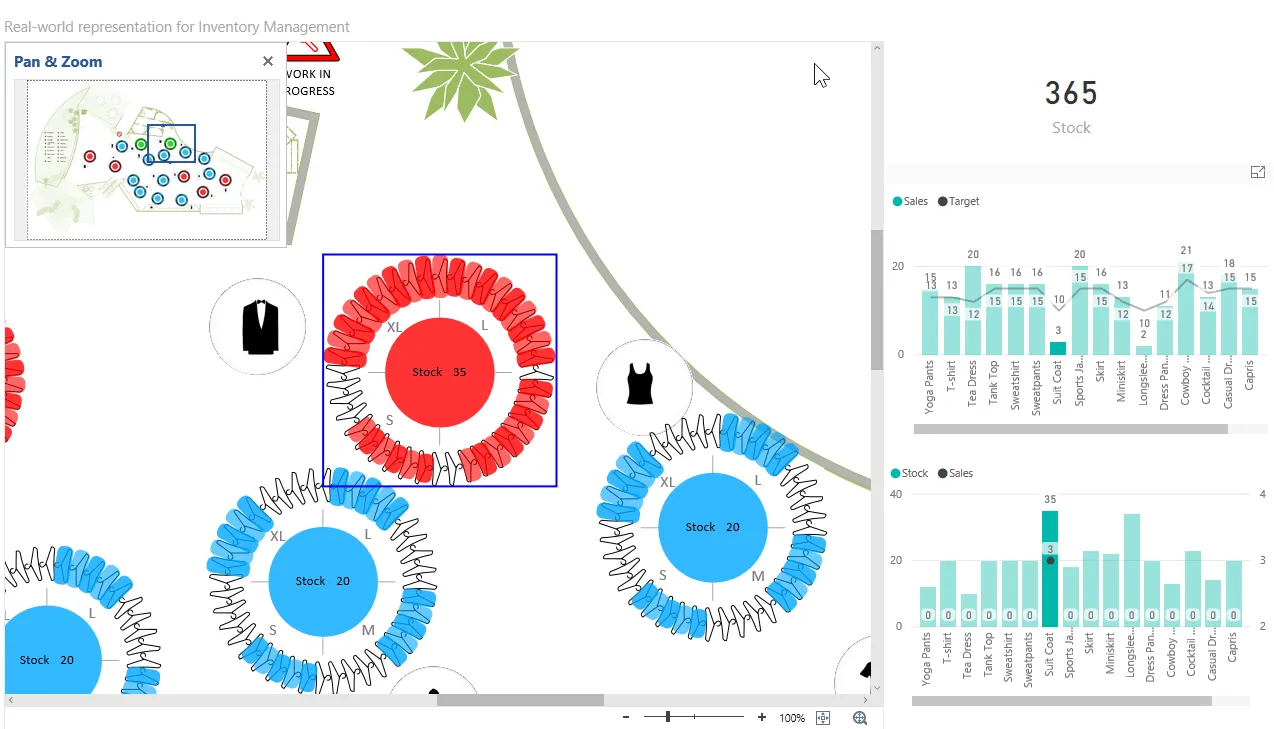
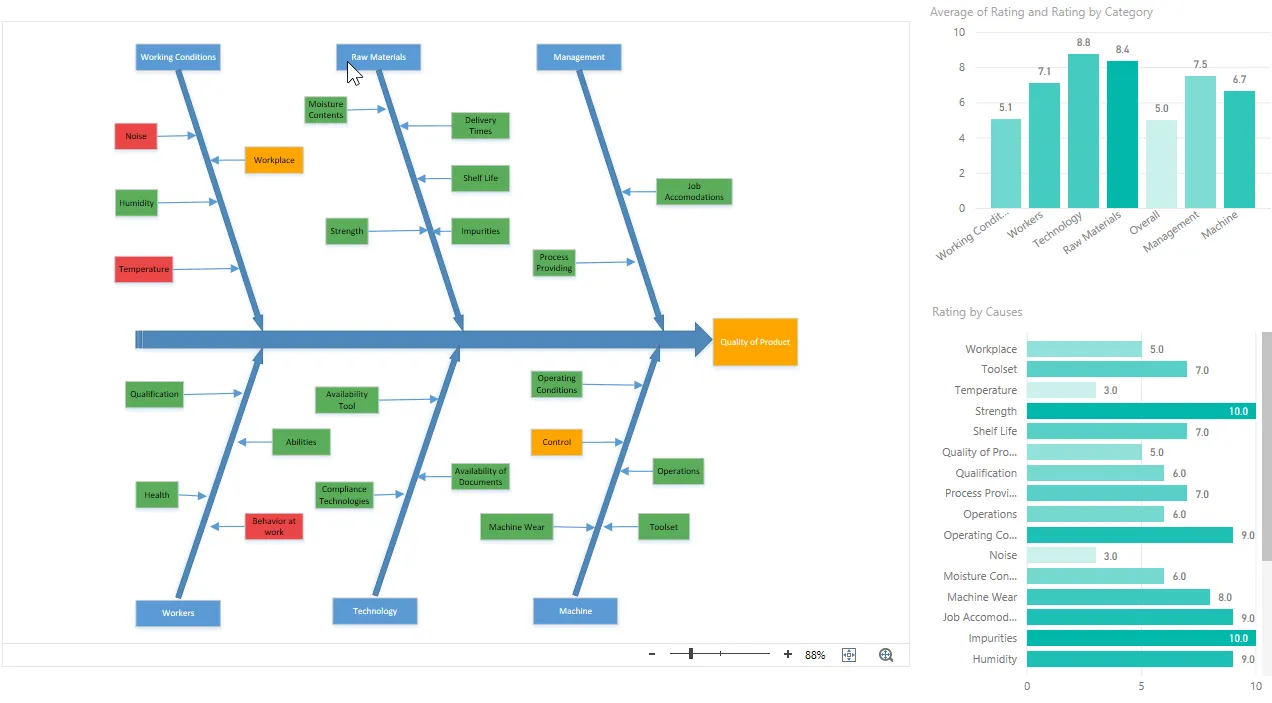
Here are a few examples taken from the interactive demonstration at Microsoft Visio PowerBI Examples:
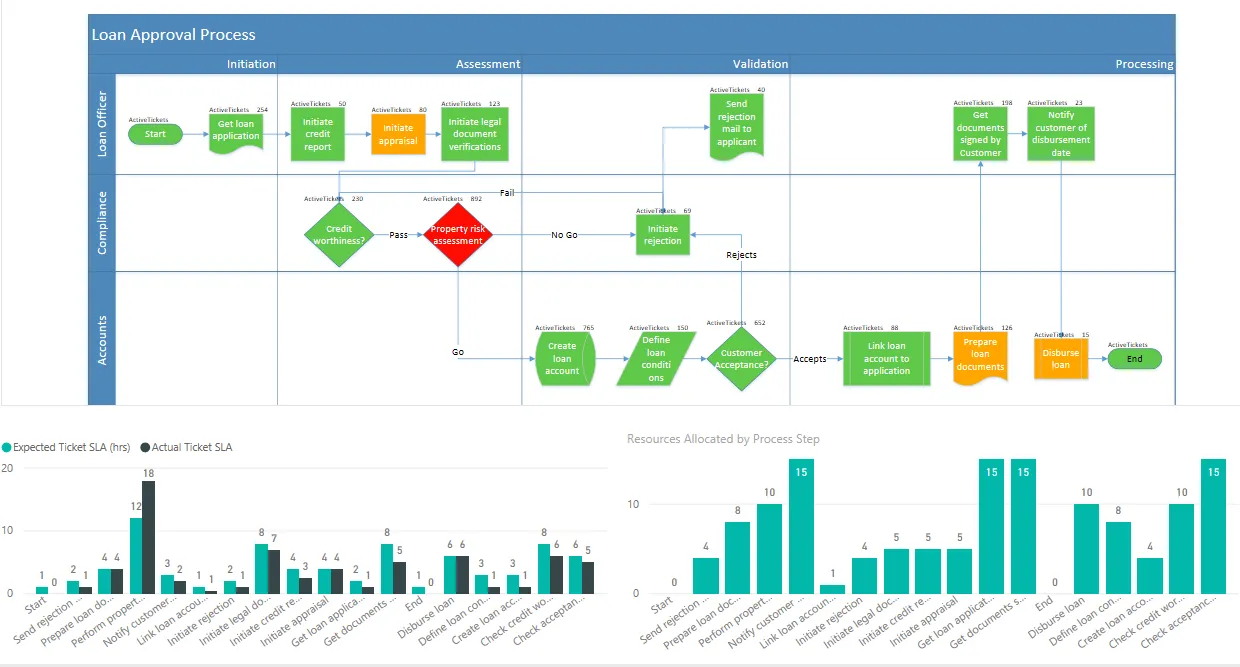
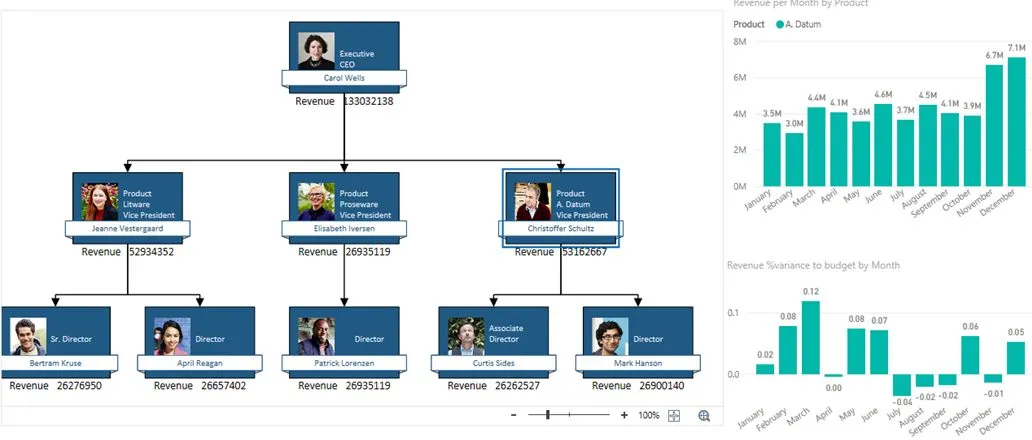
Even though many of these Visio diagrams were created with some links to data, such as Excel, SQL Server or SharePoint Lists, Power BI can be used to integrate data from many more sources such as Dynamics 365, Common Data Source, Twitter, Facebook, and many, many more.
Getting started with Visio in Power BI
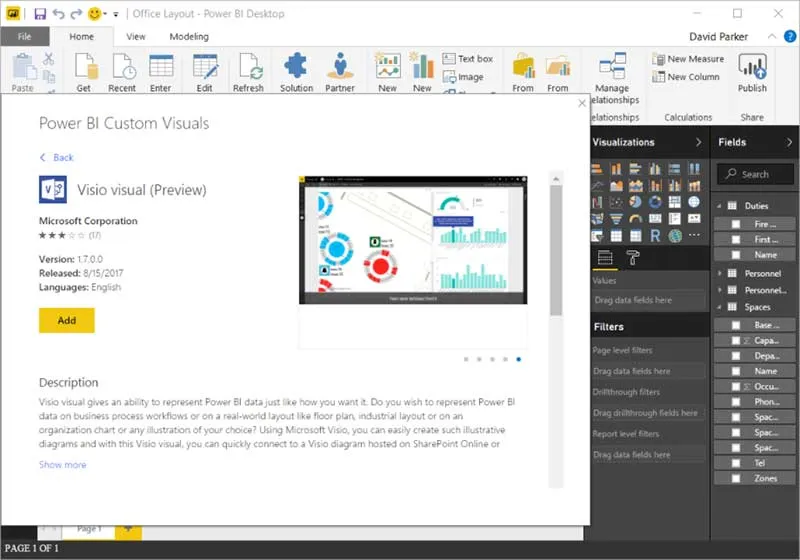
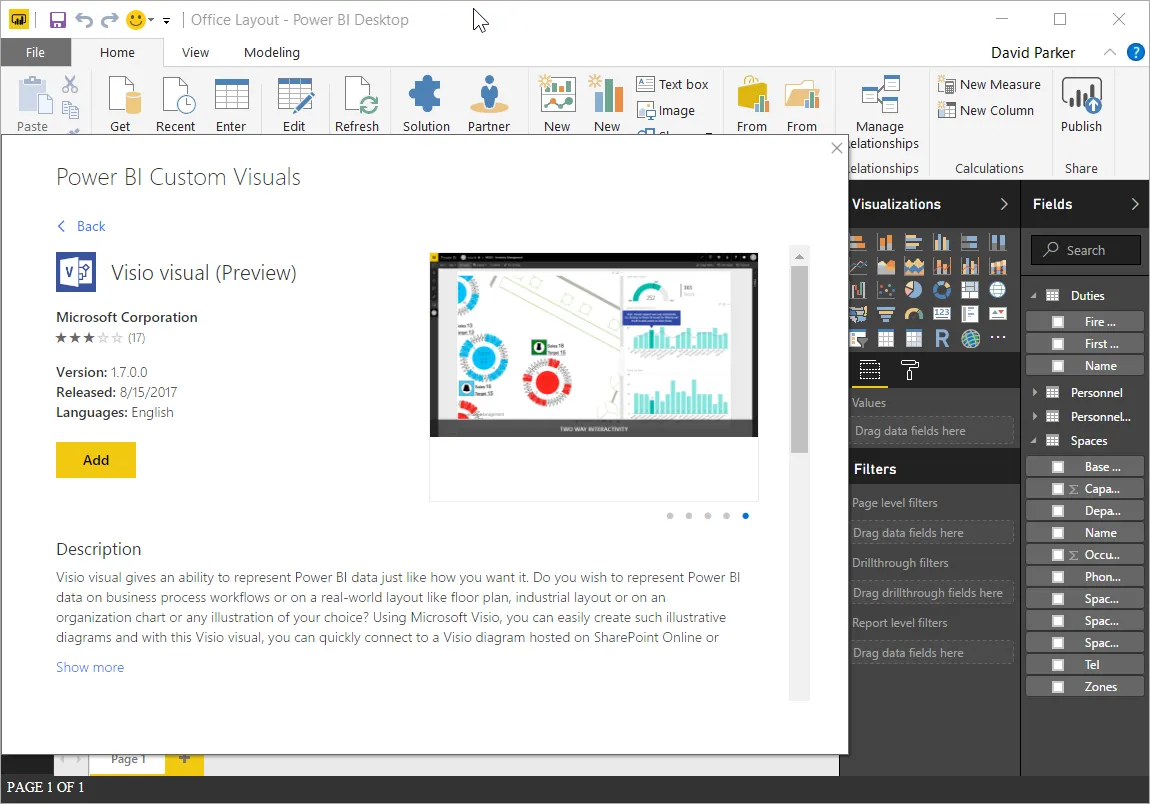
There are step-by-step instructions on the Microsoft Office support site, but, in short, all you need is to store Visio documents on SharePoint Online or OneDrive for Business, and some data that corresponds to shapes in the diagram. The diagrams are rendered using Visio Online, and all existing Data Graphics are automatically suppressed. The Visio custom visual is available from the store inside Power BI.
The data does not need to be particularly well formed because the desktop edition of Power BI (also free from powerbi.com) has some tremendous capabilities for slicing, merging, appending, filtering and reforming data. This is sometimes referred to as Power Query and uses M Formula syntax, as can be seen in Get & Transform in Excel. On top of that, it can be further manipulated with DAX (Data Analytics Expressions) and create new relationships between queries. The web-version of Power BI is less rich in features but can still be used to create Power BI reports with Visio diagrams,
There are three ways that Power BI data can be associated with Visio shapes:
- Matching values in a Shape Data row
- Matching shape text
- Manually by dragging a value onto a shape
The Power BI data values can be added to the Visio shapes as text or as color fills. Personally, I like to use the Data / Custom Import and Data / Link Data features in Visio to ensure that shapes have the necessary Shape Data values.
As mentioned, this is currently a preview of the Visio custom visual, and it does have some limitations:
- Only one page is presented and linked, and no other pages can be manually selected as the page tabs are not visible.
- There must not be more than 2,000 shapes on the page (including sub-shapes) although there may be coloring problems over 1,000 shapes.
- Colors are only possible for numeric values
- Layer manipulations are not supported
- Automatic refreshing of Shape Data is not supported
- Loading is slow for pages with a large number of shapes
- There is no Power BI action to update the Visio document url
There are some good practises that obviously arise from the above limitations, but there are some others that are not so obvious:
- Save the Visio document with the desired page active
- Save the page with the layers in the desired state
- Keep color variations in the Visio page down to the minimum so that Power BI highlights and color fills stand out.
- Layer colors are supported, and can be used to apply a grey color
- Replace embedded colourful images with greyscale versions
- Remove any Data Graphics
- That will be suppressed anyway and only add to the shape count and time to load
- Consider removing single hyperlinks from shapes as they will be followed imeddiately on click
- Multiple hyperlinks are still displayed in a popupIn fact, I would consider creating an automatic routine for large, multi-page Visio documents that automatically splits it to many single page documents, removes any Data Graphics and Data Links. The multi-page document would remain as the editable, data-linked, highly colored version, but could be split into parts on demand.
Of course, these limitations are based on the current preview version of the Visio custom visual, so they may be revised in the future.
Summary
This is big, and it will only get bigger! Microsoft are really pushing forward with cloud-based technologies, and Power BI is one the most prominent and exciting examples, along with PowerApps and Microsoft Flow. These three will get closer integration soon, and the Visio custom visual potentially links in the millions of diagrams out there in the world. Power BI is not only a dashboard and reporting system, but will increasingly be used for distributing apps that can edit data, as well as providing viewing and analysis capabilities.
Right now, it can replace many web pages that previously needed a programmer to carefully craft. This really is a democratization of visual data by putting the power to view, search and analyse into the fingertips of the user.

.webp)