
See your estate clearly
Views and visualizations
Get a clear view of your applications, capabilities, technology and change. Make better decisions, faster.
Blind Spots
Challenge: The gap between data and decisions
Too often data lives in silos, diagrams go stale, and impact is unclear. Teams need shared, trusted views to steer change with confidence.
Fragmented IT ecosystem
Apps, tech, capabilities and processes sit in different tools. It is tough to see the whole picture or align to business capability.

Static diagrams, stale decisions
Spreadsheets and slide decks cannot keep up. Teams need live, interactive views that reflect the latest repository data.

Unknown change impact
Without traceability, risk hides in dependencies. You need to see what is touched before you act.

Instant Clarity
Instant Insight
With heatmaps, matrices, list, landscapes, and traceability views available out of the box you can see opportunity clearly and publish your views anywhere so everyone sees the truth.
Landscape heatmaps and capability maps
Prioritize investment and reduce risk with powerful, comparative views that surface what matters.
- Spot hotspots with heatmaps to focus funding
- Expose capability gaps to align change
- Compare portfolios across units in one view
- Save and share views for executive reviews

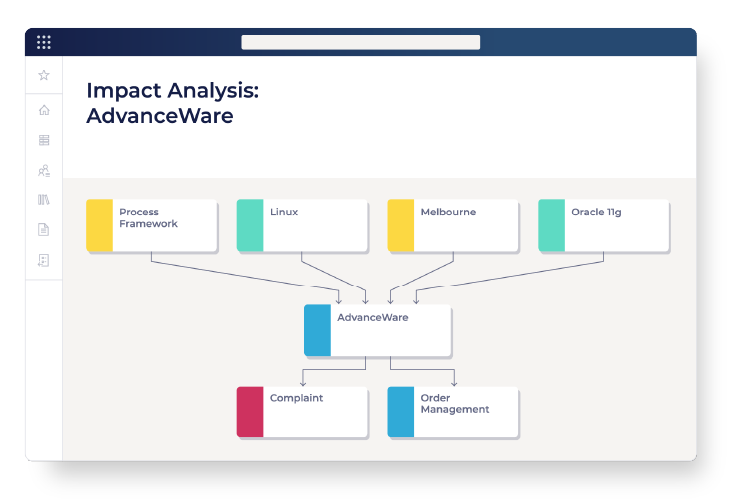
Traceability and Impact Explorer
Cut change risk and time-to-decision with clear dependency insight across domains.
- Reveal upstream and downstream impact in seconds
- Expose hidden dependencies across business and IT
- Answer “what if” to de-risk plans before funding
- Share snapshots to align teams fast
Matrix and list views
Make evidence-based calls with fast, trustworthy analysis that suits every audience.
- Rank apps to target rationalization savings
- Track lifecycle to avoid EOL and support outages
- Filter signal from noise by role or objective
- Export clearly for audits and steering packs

Manage, share and publish
Publish views direct in stakeholder dashboards.
- Publish to dashboards, SharePoint and more
- Control access with public or private views
- Standardize tags so views stay findable
- Reuse templates to scale good practice

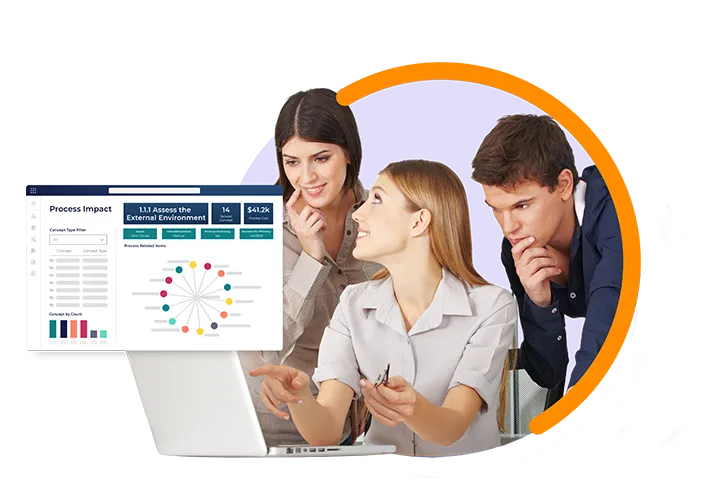
Decision Impact
Results For Every Stakeholder
From board to squad, each role gets the view they need: outcome maps for leaders, impact paths for PMO, and governed, reusable views for EA.

Executives and BU leaders
Executives and BU leaders
See business capability health, costs and risks at a glance. Use live capability maps and dashboards to prioritize investment and de-risk portfolios.

Head of EA and Architects
Head of EA and Architects
Standardize how you visualize application and technology landscapes, analyze alignment with capability, and trace change impact across domains.

PMO and Portfolio leaders
PMO and Portfolio leaders
Link strategy to execution with traceability views and Power BI reports. Understand dependencies and delivery risk before funding decisions.
Related Capabilities
More Ways to Explore Your Estate

Dashboards & Reporting
Build governed dashboards that drive action. Share the right metrics with leaders.

Modeling & Diagramming
Standardize notation and speed change. Publish diagrams that stay in sync.

Central Repository
One governed place for business, application, technology, and risk data feeds your reports.
Customer Success Stories

Instant Clarity
Fund the right change
See capability gaps and risk. Focus budget where it matters. Gain consensus fast.
Where views deliver outcomes fast
Start with packaged views, visualizations and reports for portfolio decisions and transformation planning. Expand as your needs grow.
Application portfolio rationalization
Use heatmaps and capability to application matrices to spot duplicates, risk, and savings opportunities.
Technology lifecycle management
Visualize technology by category, track lifecycle status, and identity end-of-life risk.
Transformation impact and roadmaps
Map change from strategy to impacted items with traceability and Impact Explorer, then share roadmaps with stakeholders.
Business Architecture
Explore capability maps, value streams, and customer journey maps with interactive visuals and heatmaps. Spot gaps fast, align teams, and turn strategy into a confident transformation roadmap.